
- SAP Community
- Products and Technology
- Additional Blogs by Members
- How to create Excel input forms with nested dimens...
Additional Blogs by Members
Turn on suggestions
Auto-suggest helps you quickly narrow down your search results by suggesting possible matches as you type.
Showing results for
Former Member
Options
- Subscribe to RSS Feed
- Mark as New
- Mark as Read
- Bookmark
- Subscribe
- Printer Friendly Page
- Report Inappropriate Content
01-12-2015
6:12 PM
I.Business Scenario
For a central data collection a dynamic Excel Input form for several processes (dimension members in the BPC cube) and different users is required. The relevant time and process will be set by parameters from the business process flow. Depending on the user authorisation data records will been shown or hidden without changing the original input form structure. This ensures that every user can just see the data records which (s)he is able to edit for the relevant time period and process.
Therefore fewer forms and less maintenance are necessary.
II. Background Information
With SAP BPC 10 you have two options for this scenario.
If you have just one dimension for a unique identification of your rows, you can easily filter the data-grid by user authorisation, without any additional effort.
If you have nested dimensions for a unique identification and few data records you can use the SAP EPM local member function. For each local member a unique dimension combination is necessary, to set the record to the expected position on the data-grid. The report has to be linked to the relevant cells from the data-grid.
For a complex input from with several nested dimensions and a lot of rows this approach can be quickly time-consuming and complicate a sustainable maintenance.
If you have nested dimensions within a big data set there is a third approach by creating a MS Excel macro, which is much more efficient in terms of handling and maintenance, than the local member approach.
The following scenario describes the approach:
First let’s have a look at the SAP BPC user profiles.
In addition to the administrators there are three test users named ‘SALES_*’

These have the following data access rights:
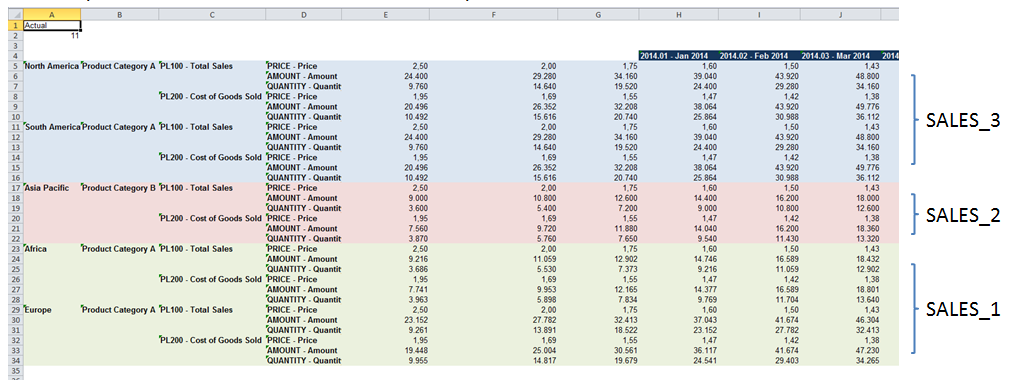
SALES_1 has read and write privileges for product category ‘A’ for the markets Africa and Europe. The Excel-Data-Grid for these entries is green coloured.

SALES_2 has read and write privileges for product category ‘B’ for the market Asia-Pacific. The Excel-Data-Grid for these entries is red coloured.

SALES_3 has read and write privileges for all product categories for the market North and South America. The Excel-Data-Grid for these entries is blue coloured.

The comprehensive view for administrators of the input sheet
Without the macro approach the user SALES_1 receives the following incorrect summarized view after opening the Excel input form.
As you can see, the data set is just reduced to one line and doesn`t show the relevant data combination any more.

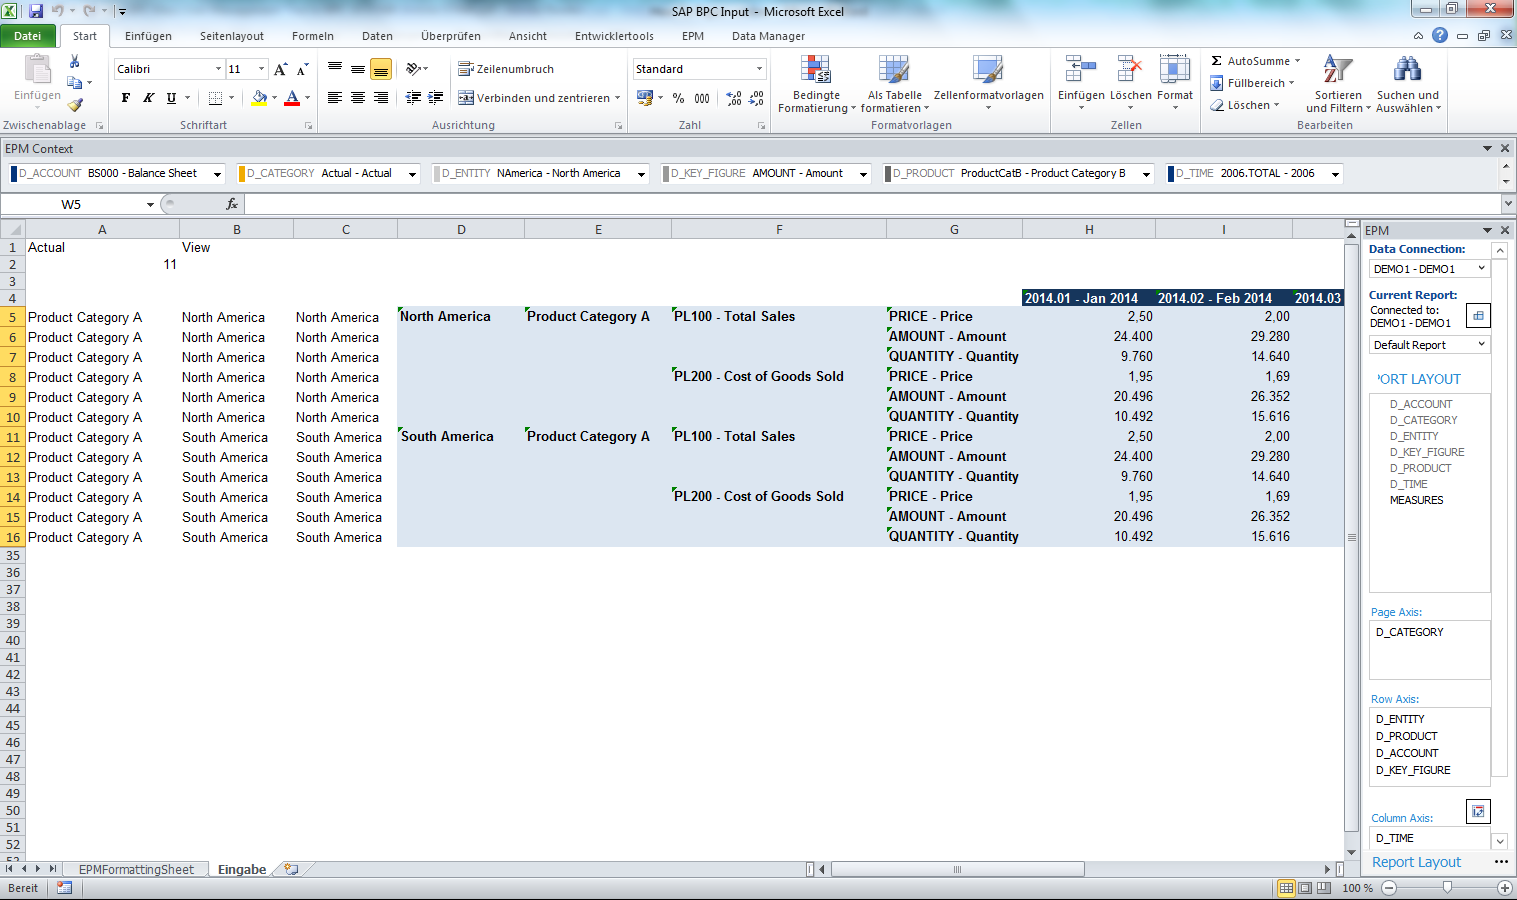
Without the macro approach the user SALES_2 receives the following incorrect summarized view after opening the Excel input form.
As you can see, the data set is just reduced to one line and doesn`t show the relevant data combination any more.

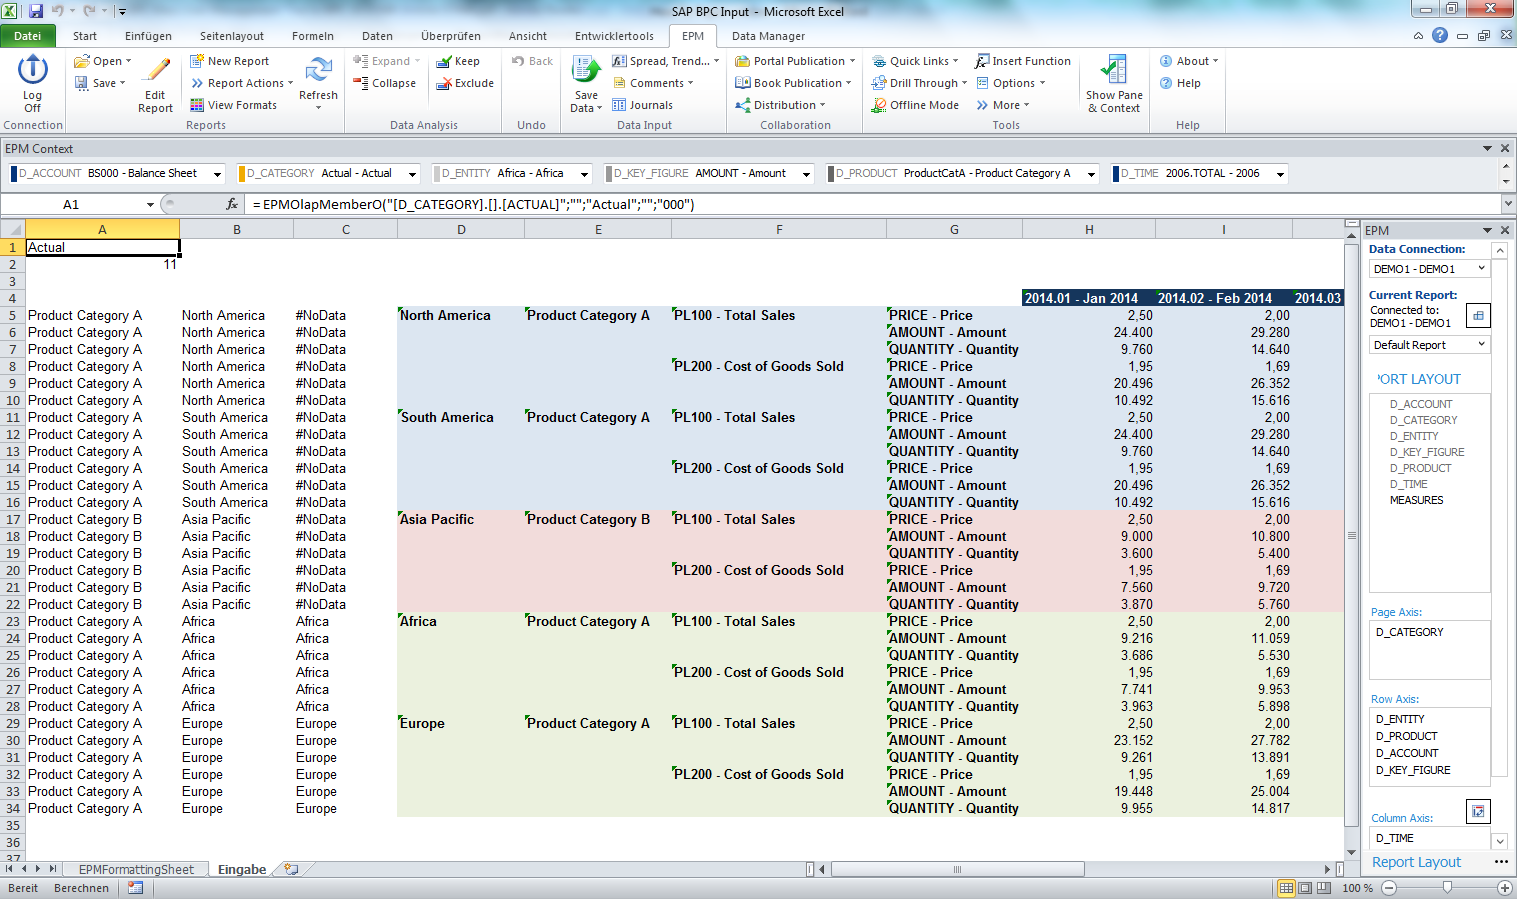
Without the macro approach the user SALES_3 receives the following incorrect summarized view after opening the Excel input form.
As you can see, the data set shows a multiplication of all possible combinations which is also not what we initially intended.

III. Step-by-Step
First we have a look at the worksheet which contains the data-grid. Left to the data-grid we add three additional columns (two for the dimensions with user authorization, and one to check the authorization on the dimension with the highest granularity) :
- For a robust structure in column A the product category for each data record is statically saved
- Also in column B the market for each data record is statically saved
- To receive the member description from column B as an access right check in column C we use the EPM formula „=EPMMemberDesc(B*)“

In this example column A and B are the dimensions for the user authorisation check. For nested dimensions SAP BPC uses additive authorisation approaches. So if we have access rights for the country we also have access rights for the product category and we receive the correct member description in column C. If we do not have the relevant access right for either dimension “#NoData” will appear.
If there are more Dimensions necessary insert adequate columns. The static content in column A and B assures a permanent consistent record structure. Therefore Cell A1 and Cell B1 are referenced in columns D and E in the
EPMOlapMemberO() formula.
- e.g.:
Line 5: EPMOlapMemberO(EPMMemberDesc(B5); EPMMemberDesc(A5);…)
Line 6: EPMOlapMemberO(EPMMemberDesc(B6); EPMMemberDesc(A6);…)
In this example column C will only receive the correct member description if the active user has the relevant privileges; otherwise “#NoData” will appear.
Next we open the source code (Alt + F11) to create a new module with a discretionary name.

First we define global constants:

The ‘input_sheet’ is the one on which the data-grid is embedded. The first data-grid input row is named ‘input_sheet_start_row’. Also we need a tracking column – named ‘check_access_column’ – with the EPM formula ‘=EPMMemberDesc(B*)’; in this example column C.
Now we create our macro with the name removeRows().

These local variables are necessary for a dynamic run of this sub. The integer ‘searchA’ is used as an index within the for-loop. The long ‘count_rows’ counts the data records in our data-grid and ‘month_number’ saves the report month.
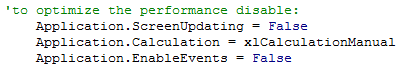
To optimize the performance during the macro run screen updating and events will be disabled. The calculation approach will be set to manual.
Next we check the quantity of reported rows and store this information in the relevant variable.

Now we check the content of the column C with the EPM formula ‘=EPMMemberDesc(B*)’; ‘#NoData’ means that the user doesn’t have the relevant authorization. Therefore the user can’t see any key figures and the row will be hidden. As an additional end point for the loop (beside ‘count_rows’) we check the content of the following column – the first data-grid column. If it is empty the loop has to stop. Also this loop sets the ‘View’ marker (for a single loop, that every new refresh won`t cause the function to run again over all records, since the irrelevant rows are already hidden).

At the bottom – at the status bar we can see the actual data record which is in progress.(“bitte warten” is the german expression for “please wait”)

The last step in this sub is to reactivate the Excel functions – screen updating, enable events and set calculation approach to automatic.

Finally we need a function to run our macro – sub removeRows() – after an EPM-Refresh.

As already mentioned above,the marker ‘View’ in cell B1 prevents a multi loop. It can be deleted at any time in source code and shall be deleted if the workbook opens.

IV. New Result
Successional the newview for administrators by the use of sub ‘removeRows’:
for SALES_1:
as you can see, the rows 5-22 are hidden in the Excel worksheet

SALES_2:
as you can see, the rows 5-16 are hidden in the Excel worksheet

and SALES_3:
as you can see, the rows 17-34 are hidden in the Excel worksheet
A Source code
‘global constants:
Public Const input_sheet = "Input"
Public Const input_sheet_start_row = 5
Public Const check_access_column = 3
Function AFTER_REFRESH()
'this function proofs whether the marker 'view' is set. If yes the
'function to hide columns will not be started - ensures a single loop.
If Sheets(input_sheet).Range("B1").Value <> "View" Then
Call removeRows
AFTER_REFRESH = True
End If
End Function
Sub removeRows()
Dim searchA As Integer
Dim count_rows As Long
'to optimize the performance disable:
Application.ScreenUpdating = False
Application.Calculation = xlCalculationManual
Application.EnableEvents = False
'set reporting rows
count_rows = Sheets(input_sheet).UsedRange.Rows.Count
'check every column regarding the user privileges whether the input row receive data or not.
'In last case the row will be hidden
For searchA = input_sheet_start_row To count_rows Step 1
Application.StatusBar = Space(50) & searchA & " bitte warten ..."
If Sheets(input_sheet).Cells(searchA, check_access_column + 4).Value = "" Then Exit For
If (Sheets(input_sheet).Cells(searchA, check_access_column).Value = "#NoData") Or _
(Sheets(input_sheet).Cells(searchA, check_access_column).Value = "") Then
Sheets(input_sheet).Rows(searchA).Hidden = True
'set marker for single loop
If Sheets(input_sheet).Range("B1").Value <> "View" Then _
Sheets(input_sheet).Range("B1").Value = "View"
End If
Next searchA
'last step is to reactivate the excel functions:
Application.StatusBar = False: Application.ScreenUpdating = True:
Application.EnableEvents = True: Application.Calculation = xlCalculationAutomatic
End Sub
Version | Date | Author | Change/Action |
0.1 | 11/21/2014 | Manuel Büdenbender | Initial document |
0.2 | 12/04/2014 | Manuel Büdenbender | User authorization explanation added |
1.0 | 12/05/2014 | Christian Niembs | Review |
Related Content
- SAC - Add Row total to Dimension Subtotal? in Technology Q&A
- SAP Datasphere - Space, Data Integration, and Data Modeling Best Practices in Technology Blogs by SAP
- Use business user rather than communication user for CDS oData call in MS Excel in Enterprise Resource Planning Q&A
- How to filter on a specific dimension member on geomap with area filter? in Technology Q&A
- How to design sales prices in SAP S/4HANA and be ready for future innovations in Enterprise Resource Planning Blogs by SAP