
- SAP Community
- Products and Technology
- Supply Chain Management
- SCM Blogs by Members
- APO DP - Forecast Model Parameters: Second-Order E...
Supply Chain Management Blogs by Members
Learn about SAP SCM software from firsthand experiences of community members. Share your own post and join the conversation about supply chain management.
Turn on suggestions
Auto-suggest helps you quickly narrow down your search results by suggesting possible matches as you type.
Showing results for
marianoc
Active Contributor
Options
- Subscribe to RSS Feed
- Mark as New
- Mark as Read
- Bookmark
- Subscribe
- Printer Friendly Page
- Report Inappropriate Content
08-15-2014
3:08 PM
This document reviews the impact of the parameters of the Second-Order Exponential Smoothing. The explanation follows a graphical approach without going into the heavy mathematics behind them.
This Forecasting model introduces a new statistical concept: Trend (Beta). It also uses the parameter Alpha, which was already introduced in the previous document:
APO DP - Forecast Model Parameters: First-Order Exponential Smoothing
1. Model Selection: Sales pattern
If you want to select a model manually, then you must analyze the historical data to determine whether a distinct pattern exists according to which you can manually select a model for the system.
Trend pattern:
If your historical data represents a suspected trend behavior, you can then select the second-order exponential smoothing (Holt Model).
Suppose that you have the following sales pattern, the constant forecast is clearly not appropriate here:
a = 0.3

We need to incorporate the significant trend Pattern, for this we use Beta.
Simple exponential smoothing does not do well when there is a trend in the data. In such situations, it could be useful to apply a second-order exponential smoothing Model (Holt Model). The basic idea behind double exponential smoothing (Holt Model) is to introduce a term to take into account the possibility of a series exhibiting some form of trend.
2. Forecast Model Parameters: Second-Order Exponential Smoothing - Holt Model
The 2nd order exponential smoothing model without the seasonal pattern is also called Holt Model. In the opposite, models with Seasonal patterns and no tred are called Winters.
Model Parameters:

Alpha factor:
The system uses the alpha factor for smoothing the basic value. If you do not specify an alpha factor, the system will automatically use the alpha factor 0.3.
Beta factor:
The system uses the beta factor for smoothing the trend.
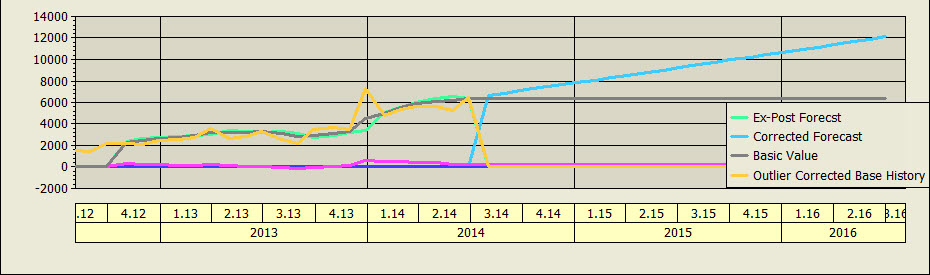
In the following forecasting graphs you will see the impact of Beta (with a constant alpha = 0.3):
b = 0.1 / a = 0.3 -> (MAPE = 16.39)

b = 0.2 / a = 0.3 -> (MAPE = 15.45)

b = 0.3 / a = 0.3 -> (MAPE = 15.37)

b = 0.4 / a = 0.3 -> (MAPE = 15.86)
b = 0.5 / a = 0.3 -> (MAPE = 16.48)

b = 0.6 / a = 0.3 -> (MAPE = 17.03)

b = 0.7 / a = 0.3 -> (MAPE = 17.51)

b = 0.8 / a = 0.3 -> (MAPE = 17.91)

b = 0.9 / a = 0.3 -> (MAPE = 18.31)

The choice of Beta is very important: the following table contains the monthly forecasting quantity of the different b beta factors for alpha = 0.3:

Note that the forecast got with beta 0.1 is 2 times bigger than the forecast got with beta 0.9.
Conclusion: 0.3 is a good compromise
- b (beta) close to 0: use a longer horizon to forecast the trend.
- b (beta) close to 1: will probably use only the last few values to estimate the trend.
- SAP Managed Tags:
- SAP Advanced Planning and Optimization
6 Comments
You must be a registered user to add a comment. If you've already registered, sign in. Otherwise, register and sign in.
Labels in this area
-
aATP
1 -
ABAP Programming
1 -
Activate Credit Management Basic Steps
1 -
Adverse media monitoring
1 -
Alerts
1 -
Ausnahmehandling
1 -
bank statements
1 -
Bin Sorting sequence deletion
1 -
Bin Sorting upload
1 -
BP NUMBER RANGE
1 -
Brazil
1 -
Business partner creation failed for organizational unit
1 -
Business Technology Platform
1 -
Central Purchasing
1 -
Charge Calculation
2 -
Cloud Extensibility
1 -
Compliance
1 -
Controlling
1 -
Controlling Area
1 -
Data Enrichment
1 -
DIGITAL MANUFACTURING
1 -
digital transformation
1 -
Dimensional Weight
1 -
Direct Outbound Delivery
1 -
E-Mail
1 -
ETA
1 -
EWM
6 -
EWM - Delivery Processing
2 -
EWM - Goods Movement
4 -
EWM Outbound configuration
1 -
EWM-RF
1 -
EWM-TM-Integration
1 -
Extended Warehouse Management (EWM)
3 -
Extended Warehouse Management(EWM)
7 -
Finance
1 -
Freight Settlement
1 -
Geo-coordinates
1 -
Geo-routing
1 -
Geocoding
1 -
Geographic Information System
1 -
GIS
1 -
Goods Issue
2 -
GTT
2 -
IBP inventory optimization
1 -
inbound delivery printing
1 -
Incoterm
1 -
Innovation
1 -
Inspection lot
1 -
intraday
1 -
Introduction
1 -
Inventory Management
1 -
Localization
1 -
Logistics Optimization
1 -
Map Integration
1 -
Material Management
1 -
Materials Management
1 -
MFS
1 -
New Feature
1 -
Outbound with LOSC and POSC
1 -
Packaging
1 -
PPF
1 -
PPOCE
1 -
PPOME
1 -
print profile
1 -
Process Controllers
1 -
Production process
1 -
QM
1 -
QM in procurement
1 -
Real-time Geopositioning
1 -
Risk management
1 -
S4 HANA
1 -
S4 HANA 2022
1 -
S4-FSCM-Custom Credit Check Rule and Custom Credit Check Step
1 -
S4SCSD
1 -
Sales and Distribution
1 -
SAP DMC
1 -
SAP ERP
1 -
SAP Extended Warehouse Management
2 -
SAP Hana Spatial Services
1 -
SAP IBP IO
1 -
SAP MM
1 -
sap production planning
1 -
SAP QM
1 -
SAP REM
1 -
SAP repetiative
1 -
SAP S4HANA
1 -
SAP TM
1 -
SAP Transportation Management
3 -
SAP Variant configuration (LO-VC)
1 -
SD (Sales and Distribution)
1 -
Source inspection
1 -
Storage bin Capacity
1 -
Supply Chain
1 -
Supply Chain Disruption
1 -
Supply Chain for Secondary Distribution
1 -
Technology Updates
1 -
TMS
1 -
Transportation Cockpit
1 -
Transportation Management
2 -
Visibility
2 -
warehouse door
1 -
WOCR
1
- « Previous
- Next »
Related Content
- SAP IBP: Enhancing Forecast Accuracy with Time Series Analysis and Change Point Detection in Supply Chain Management Blogs by SAP
- Condition Based Maintenance with SAP Asset Performance Management (SAP APM) and SAP Data Intelligence - Concept and Use Case in Supply Chain Management Blogs by SAP
- Ex-Post forecast or Test Phase? How to determine the best forecasting algorithm in Supply Chain Management Blogs by SAP
- SAP Integrated Business Planning for Supply Chain (SAP IBP) 2308 – Available Now! in Supply Chain Management Blogs by SAP
- How does IBP select fcst algorithm in case of insufficient data based on time series analysis in Supply Chain Management Q&A
Top kudoed authors
| User | Count |
|---|---|
| 3 | |
| 3 | |
| 2 | |
| 2 | |
| 2 | |
| 1 | |
| 1 | |
| 1 | |
| 1 | |
| 1 |