
- SAP Community
- Groups
- Interest Groups
- Application Development
- Blog Posts
- Unleash the power of SAP HANA from your ABAP Custo...
Application Development Blog Posts
Learn and share on deeper, cross technology development topics such as integration and connectivity, automation, cloud extensibility, developing at scale, and security.
Turn on suggestions
Auto-suggest helps you quickly narrow down your search results by suggesting possible matches as you type.
Showing results for
Former Member
Options
- Subscribe to RSS Feed
- Mark as New
- Mark as Read
- Bookmark
- Subscribe
- Printer Friendly Page
- Report Inappropriate Content
06-27-2014
7:07 AM
2. Detect and Prioritize your Custom Code
Prerequisites
Before you start reading this blog it is good to read the blog series.
- Introduction - Unleash the power of SAP HANA from your ABAP Custom Code -http://scn.sap.com/community/abap/hana/blog/2014/06/20/abap-custom-code-management--leverage-the-pow...
- Unleash the power of SAP HANA from your ABAP Custom Code- Accelerate your custom reports like never before - Functional Correctness - http://scn.sap.com/community/abap/hana/blog/2014/06/20/unleash-the-power-of-sap-hana-from-your-abap-...
- NOTE: This blog contains information collected from various sources. The objective is give the continuity with the previous blog series and also to give an example of how have we used the tools to find the performance hot spots and how did we prioritize.
Introduction
After functional correctness, the custom code is ensured to result as expected after migration to SAP HANA. In general, the custom code gets default performance improvement by using the in-memory capabilities. But often, custom code is not written by following the SAP standard guidelines hence there is lack of performance. This section explains the next steps for improving the performance for custom code.
Golden Rules and Its Priority changes for SAP HANA
One should really know the basics of performance optimizations. To understand that, you should have clear understandings of "Golden Rules of SQL" and the priority changes with respect to SAP HANA. The image below depicts the golden rules of SQL. With respect to SAP HANA there are some priority changes on the rule.
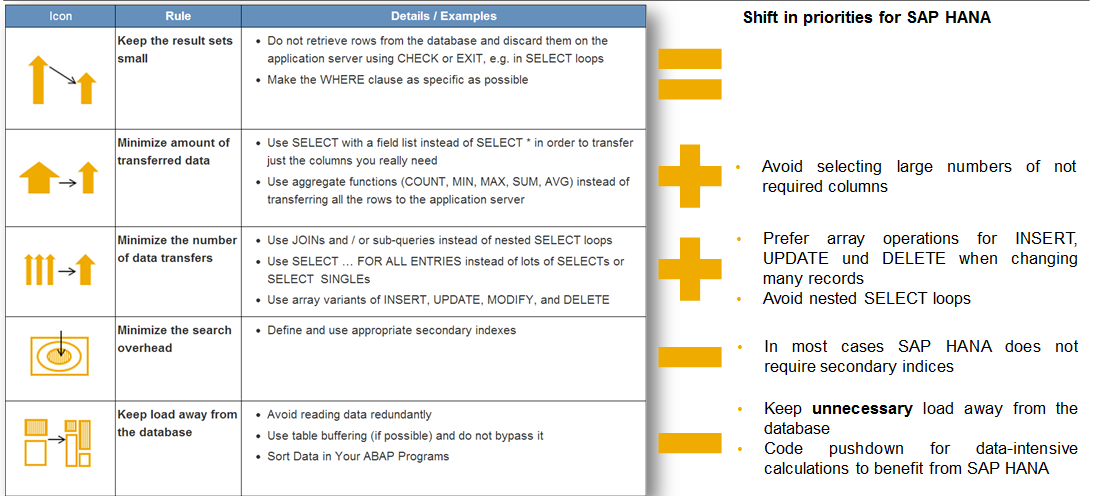
There are five important golden rules should be followed by any (SAP) Application/Report. Let see the rule before and after SAP HANA and its priority changes.
- Keep the result sets small: it is very important that the application should not load all or irrelevant data from database layer to application layer. This rule applies with the same priority for SAP HANA as well.
- Minimize the Amount of Transferred data: While reading from the database, the application should be fetch only the data for the further calculation. The conditions on the business logic should be transferred as where conditions or filters to reduce the amount data fetched. With respect to SAP HAHA, the priority is increased for this rule.
- Minimize the number of database calls: The application should not make unnecessary access to database as it is costly operation. Hence application should think of using JOINs and FAEs as much as possible to reduce the number of calls. Also, SELECT SINGLE on LOOP, NESTED SELECTs should be avoided. With respect to SAP HANA, this takes more priority.
- Minimize the search overhead: With respect to SAP HANA this takes low priority because the SAP HANA has very powerful search engine the application can really make use of it.
- Keep load away from Database: This rule also takes low priority with respect to SAP HANA because of SAP HANA’s in memory capabilities. SAP recommends pushdown the data intensive business logic as much as possible to database layer by means of HANA artefacts.
Detecting potential hot spots for optimization
When we talk about performance customers asks one basic question, “how can I find ABAP code which shall be optimized or which has potential for massive acceleration”. The answer is, in general no changes are necessary if your SQL code or Custom code follows the golden Open SQL rules. The ATC or SCI checks can be used to find the SQL patterns that violate the golden Open SQL rules. Add runtime performance data from production system to rank the findings and to find potential for massive acceleration. The code check tool (ATC/SCI) now has been improved with additional checks to identify the performance loopholes.
The image below shows the additional checks on the ATC tool and mapped with the golden rules to show the relevance.

There are additional checks on the section “Performance Checks”, which identifies the code for performance loopholes. These checks indicates the improvement on,
- Unused data from the select statements
- Checks which can nullify the data retrieved
- Unsecure use of FAE. This identifies the FAE table is empty or not. If empty it would ideally result the whole database table on the select statement which is very costly.
SQL Monitor Tool
The SQL Monitor tool is used to identify the performance traces of each and every SQL statement which is executed on the ABAP Server (Generally in production system). This tool can get the answer for some of the questions with respect to optimization.
- What are the most expensive statements in my ABAP code?
- What are the most frequent statements executed in my ABAP code?
- Which are the most read/write operations in my ABAP code?
None of the standard performance analysis tools you might know is capable of answering any of these questions in a satisfying way. Let’s take a moment to figure out why.
Trace tools like ST05 (SQL Trace) or SAT (ABAP Runtime Analysis), on the one hand, are designed to trace a single process but not your entire system. Hence, even if activated only for a short period of time, the trace files would become way too big and the performance overhead would be unacceptable in a productive system. Monitoring tools such as STAD (Business Transaction Analysis) and ST03 (Workload Monitor), on the other hand, run system-wide and provide aggregated performance data on the process level. However, they don’t allow you to drill down in the data so there is no way to get the SQL profile of a process. Other monitoring utilities like ST04 (DB Performance Monitor) supply you with detailed information about every executed SQL statement but cannot provide a link to the driving business processes.
So how can you answer the questions stated above? This is where the new SQL Monitor kicks in by providing you with system-wide aggregated runtime data for each and every database access. You may think of it as an aggregated SQL trace that runs permanently and without user restriction. On top of that, the SQL Monitor also establishes a connection between the SQL statement and the driving business process. To be more precise, this tool not only provides you with the source code position of every executed SQL statement but also with the request’s entry point that is, for instance, the transaction code.

SAP recommends activating the SQL monitor tool on the custom production system at least for a week. Often cases, it needs to be activated for two week. The SQL monitor collects all the runtime traces of all the SQL Statement executed over the period of activation. This data can be exported and uploaded a snapshot to the development or quality system which can be used to analyze further for detecting the performance potentials. The above diagram is a collection of SQL Statements executed over a span of week on the production system. This gives insights of,
- The SQL Statement – Most number of executions
- The SQL Statement – Most volume of data transferred
- The Call stack – Indicates the location of the SQL statement and how it is being executed
Prioritize the findings
The next step after collecting the runtime traces, one needs to prioritize the finds. For doing this, SAP delivered a tool named “SQL Performance Tuning Work list (SWLT)” which combines the result of static checks and runtime findings.
The SQL Performance Tuning Worklist tool (transaction /SWLT) enables you to find ABAP SQL code that has potential for performance improvement in productive business processes. This tool combines new ABAP code scans (ABAP Test Cockpit or Code Inspector /SCI) with monitoring and analysis utilities (SQL Monitor and Coverage Analyzer), and automatically creates a condensed worklist. The resulting findings allow you to rank the worklist according to specific performance issues and your business relevance. Prior to analyzing static checks, appropriate ABAP test cockpit runs must be performed in the case of systems and their results must be replicated into the relevant system.
The image below explains how the static and runtime findings are combined on one tool called SWLT.
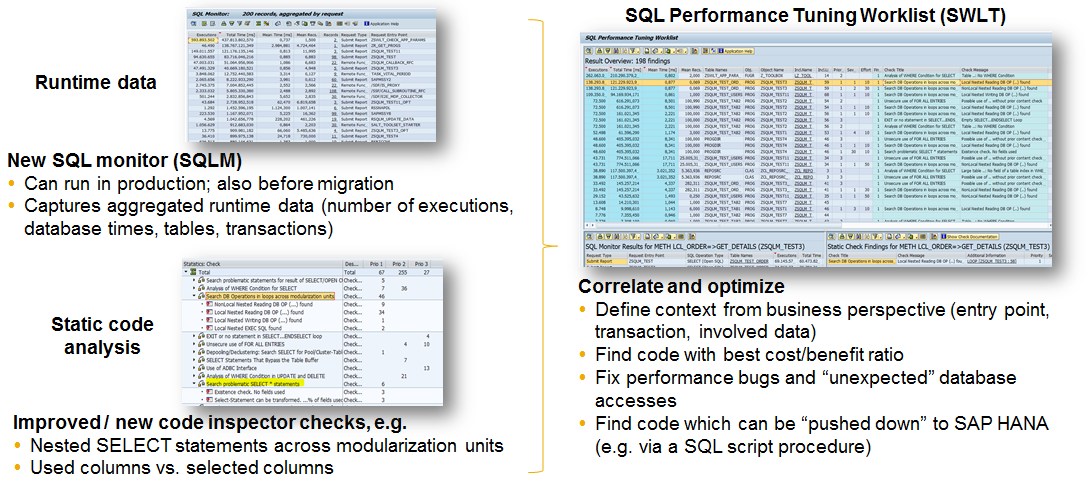
The SWLT tool allows managing the snapshots of SQLM taken from production system and combines the result with ATC results to prioritize the optimizations. With the combined result of ATC and SQLM results it becomes easy to prioritize.
Considerations to Prioritize
To prioritize the findings, one can consider the following inputs.
- The SQL Monitor results - The top most SQL statements which have consumed most of the DB/Execution (run)time.
- The ATC check results - The ATC Check results which indicated certain performance loopholes on the code
- The SWLT results - The SWLT results which co-relates the static check findings and runtime findings (ATC + SQLM).
Apart from these three above inputs there are other inputs has to be considered.
- The business impact - The business value gained for optimizing the top listed SQLM or SWLT findings. This can be derived from the customer inputs mostly from the functional team from customer site.
- Customer Input - Customer would have already prepared a list of reports based on the business value / need.
Follow up blogs
The blog series would discuss the different phases of the custom code management as follows.
- Optimize your Custom Code - http://scn.sap.com/community/abap/hana/blog/2014/06/27/unleash-the-power-of-sap-hana-from-your-abap-...
- Please note that the approach shared here is a completely iterative and flexible model which is just suggestive in nature rather than a rigid process.
- SAP Managed Tags:
- ABAP Development
You must be a registered user to add a comment. If you've already registered, sign in. Otherwise, register and sign in.
Labels in this area
-
A Dynamic Memory Allocation Tool
1 -
ABAP
8 -
abap cds
1 -
ABAP CDS Views
14 -
ABAP class
1 -
ABAP Cloud
1 -
ABAP Development
4 -
ABAP in Eclipse
1 -
ABAP Keyword Documentation
2 -
ABAP OOABAP
2 -
ABAP Programming
1 -
abap technical
1 -
ABAP test cockpit
7 -
ABAP test cokpit
1 -
ADT
1 -
Advanced Event Mesh
1 -
AEM
1 -
AI
1 -
API and Integration
1 -
APIs
8 -
APIs ABAP
1 -
App Dev and Integration
1 -
Application Development
2 -
application job
1 -
archivelinks
1 -
Automation
4 -
BTP
1 -
CAP
1 -
CAPM
1 -
Career Development
3 -
CL_GUI_FRONTEND_SERVICES
1 -
CL_SALV_TABLE
1 -
Cloud Extensibility
8 -
Cloud Native
7 -
Cloud Platform Integration
1 -
CloudEvents
2 -
CMIS
1 -
Connection
1 -
container
1 -
Debugging
2 -
Developer extensibility
1 -
Developing at Scale
4 -
DMS
1 -
dynamic logpoints
1 -
Eclipse ADT ABAP Development Tools
1 -
EDA
1 -
Event Mesh
1 -
Expert
1 -
Field Symbols in ABAP
1 -
Fiori
1 -
Fiori App Extension
1 -
Forms & Templates
1 -
IBM watsonx
1 -
Integration & Connectivity
10 -
JavaScripts used by Adobe Forms
1 -
joule
1 -
NodeJS
1 -
ODATA
3 -
OOABAP
3 -
Outbound queue
1 -
Product Updates
1 -
Programming Models
13 -
RFC
1 -
RFFOEDI1
1 -
SAP BAS
1 -
SAP BTP
1 -
SAP Build
1 -
SAP Build apps
1 -
SAP Build CodeJam
1 -
SAP CodeTalk
1 -
SAP Odata
1 -
SAP UI5
1 -
SAP UI5 Custom Library
1 -
SAPEnhancements
1 -
SapMachine
1 -
security
3 -
text editor
1 -
Tools
16 -
User Experience
5
Top kudoed authors
| User | Count |
|---|---|
| 5 | |
| 5 | |
| 3 | |
| 3 | |
| 2 | |
| 2 | |
| 2 | |
| 2 | |
| 1 | |
| 1 |