Skip to Content
Author's profile photo Former Member

Using Infinite Insights with SAP Lumira

With SAP Lumira you can now bring predictive capabilities not only in the hands of a data scientist but in the hands of an end user.


I have used an Airline dataset which is publicly available. The Airline company names have been masked.

Public Storyboard on Airline dataset: https://cloud.saplumira.com/open?key=539D59C7EA861120E10000000A4E4243&type=HANALYTIC


I have enabled the predictive feature in the product and will be analyzing influencers based on the measure called : “Total Revenue”.


This will help me find out how an Airline Industry can predict the Total Revenue for a given time-frame based on the data in hand.


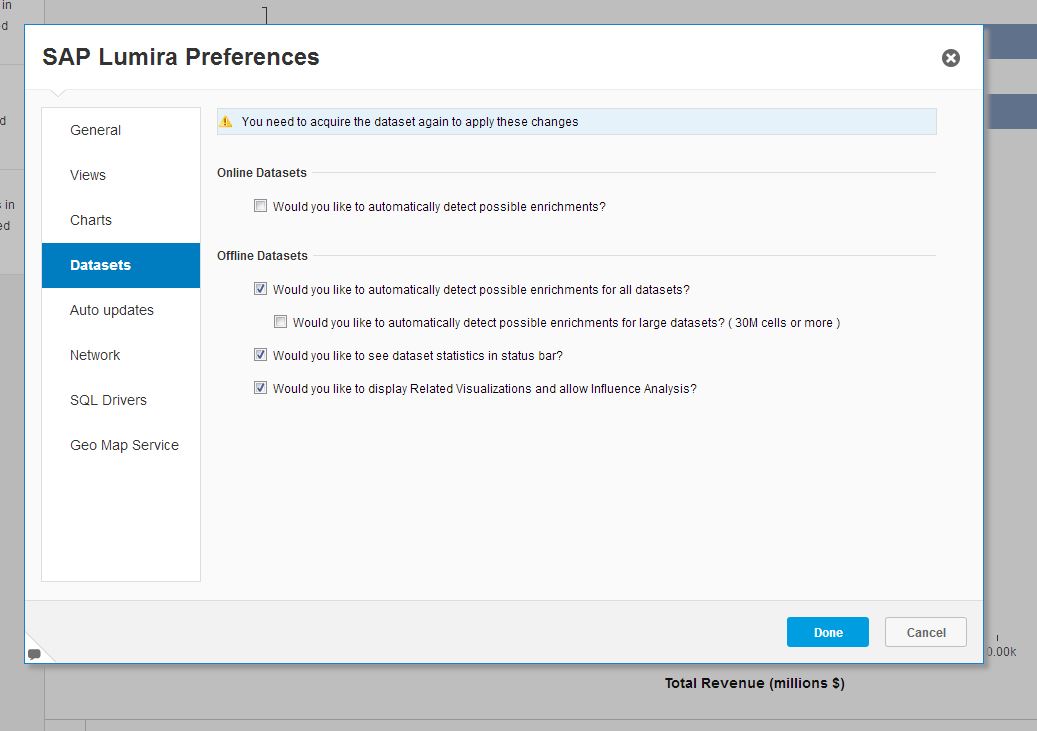
To ensure Influence Analysis is enabled in SAP Lumira check your Desktop preferences from the File Menu :


pref.JPG


From the given data-set I am trying to find out how can I directly impact and predict the Total Revenue generated by an Airline Company.


Tot rev.JPG

So I am going to predict the influencers for Total Revenue from the given dataset. For this I will run an “Analysis” on the attribute named – Total Revenue.


Click on the Related Visualizations tab.


/wp-content/uploads/2014/06/insight_475894.png


Then I select the measure: “Top Revenue” and  click “Run the analysis”. System automatically runs an analysis and  helps determine out what are the attributes which influence Total Revenue.


RunAnalysis.png

The first result that appears is a ‘meta’ chart intending on providing an overview of the most highly correlated dimensions for the measure (in our case “Total Revenue” generated by any Airline). This is intended on being informative (i.e. it helps the user understand their dataset better) and not included in stories.  It appears in a pop-up instead of loading on the main canvas like other suggestions. When viewing this chart mouse over the dimensions to get a sense for the strength of correlation.


The next 3 results in the suggestions panel are the same measure plotted against across the top 3 most highly correlated dimensions results from the first chart. Clicking on any of these 3 results will load them into the main viz window at which point they can be used in a story.


We are looking at the top influencers for “Total Revenue generated by Airline” this pop-up here illustrates the top influencers.


/wp-content/uploads/2014/06/afteranal_475897.png

This analysis finds out that“Percent of Flights that are cancelled” is one of the top influencers. We will explore Total revenue against this top influencer and see how it affects our measure – Total Revenue.

For that I select it, then hit the button below which says “Explore Total Revenue by Percent of Flights that are cancelled”


Explore.JPG

The bar chart which is created in the visualization space shows how the total revenue is varying based on this particular influencer.

  You can save this chart and add it your storyboard to see how this attribute directly impacts the revenue and thus predicting the Total Revenue of the company :

Totalrevanalys.JPG

Assigned Tags

      7 Comments
      You must be Logged on to comment or reply to a post.
      Author's profile photo Former Member
      Former Member

      Hi Avni,

      Great post! However when I try to execute the 'Run Analysis' I get the following error message:

      Lumira_Run_Analysis.png

      Do you have any idea if this could be dataset related (I'm using another dataset) or SAP Lumira related. Can I find any logs? I noticed that the feature is not documented in the User Guide or am I overlooking something?

      Thanks for your reply!

      With kind regards,

      Martijn van Foeken

      Author's profile photo Former Member
      Former Member

      Hi Avni,

      I tried a different data set (which was included in the Infinite Insight workshop) and this is displaying the results as described in your blog!

      With kind regards,

      Martijn van Foeken

      Author's profile photo Antoine CHABERT
      Antoine CHABERT

      Hi,

      Usually looking at Lumira log file you will find more useful information and error messages in the traces. I do not understand why these messages are not displayed to the end-user.

      Regards,

      Antoine

      Author's profile photo Witalij Rudnicki
      Witalij Rudnicki

      What is the exact meaning of this correlation indexes (like 0.32 on this screen)? Thank you.

      TopInfluencer.png

      Author's profile photo Henry Banks
      Henry Banks

      It means that  the top influencer of metric "page views"  is the attribute (or "variable" in stats speak) "Developer Sp.."

      Therefore your predictive model for 'page views' only had 3 variables to consider: 'developer' , 'country' and 'month',  then 32% of the model's fit-accuracy (and therefore predictive outcome on the target variable) can be attributed solely to 'country' (i.e. on its own, not significant)

      'Developer sp' has a stronger correlation to the influence of "page views" - something like 55%

      I hope this helps

      regards,

      H

      Author's profile photo Antoine CHABERT
      Antoine CHABERT

      Hi,

      Just to briefly elaborate on Henry's answer.

      Your model produced using infinite insight (II) could explain well the target variable... or not.

      in II the quality of the model is expressed using a indicator called the KI. If your KI is close to 1 you have a strong model, if it is close to 0 you have a weak model.

      The influencers are part of the model. So they should not be read as 32% predictive power on the target variable but rather as 32% of the predictive power of the model... in case your model is very weak it would mean a low predictive power to the target variable.

      Hope it does help, I am just trying to unveil the data science cover to avoid misinterpretations.

      My personal opinion is that the KI indicator should be available as an information to Lumira end-users so that they interpret right the top influencers information.

      My 2 cents

      Antoine

      Author's profile photo Henry Banks
      Henry Banks

      thanks! good point well made 🙂