Enterprise Mobility : Business Importance
- Tablet industry growing from 233 million in 2013 to 1 billion in 2017 for a CAGR of 36%, according to Yankee group
- According to a recent study, By 2015, the world's mobile worker population will reach 1.3 billion, representing 37.2% of the total workforce. According to an updated forecast from International Data Corporation (IDC)
- Mobile analytics gives enterprise organization the ability to analyze, collaborate, and act within a single workflow for better decisions - across lines of business and in any industry, which involves high volume of business data in the backend
- Utilizing mobile devices requires that by considering limited CPU speed, reduced memory and storage, narrow bandwidth and high latency connections, and limited battery life
- Complex device/user traffic

- High user experience (Mobile ≠ Desktop !!!)

- Devices with different hardware configurations
- Diverse network connectivities/technologies
It is important to achieve good performance and scalability with Mobile Enterprise Applications.
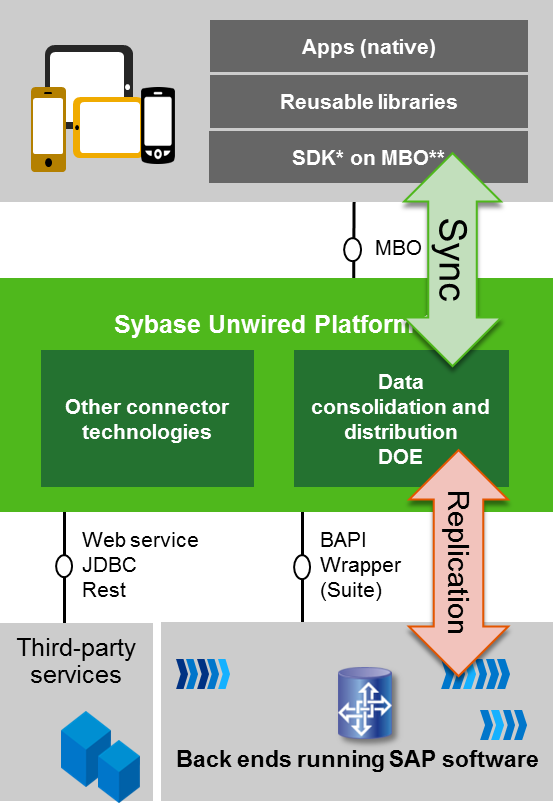
Enterprise Mobility - Architecture

Important Performance KPIs for Mobile Applications
- End 2 End Response : Very high priority KPI in the customer perspective. This will be the combination of response time from each layer(Device to Middleware to backend to device).
Remark : E2E response also includes the network latency. LAN network latency b/w different application server back ends with middleware and WiFi/3G/4G network latency, where device operates. Since control over network latency is limited, tight coding standards to achieve better performance is important.
- Roundtrips : one network roundtrip per user interaction step.
- Transferred data volume : Keep the data volume as low as possible (approx. 10 ~ 20 KB per user interaction step).
- CPU Time : Minimum device CPU consumption.
- Memory : Minimum memory consumption.
- Memory Leak : Zero memory leaks
Performance Characteristics - Offline Application
Data Volume and Throughput Characteristics
- App performance is determined by device persistence performance
- Typical number of total BO instances on a single device is dependent on the platform
- Typical throughput of 100 uploaded CRUD messages per device and day
Resource Consumption on Server Side
- Low performance impact on backend system
- DOE is the multiplying component
- Typically two synchronization peaks per day (Morning and Afternoon)
- Sizing of landscape is critical because of idle vs. peak time
Performance Characteristics - Online Application

Data Volume and Throughput Characteristics
- Each device is fetching the business data from the backend
- Low number of screens/objects
- Low number of CRUD messages per device and day
- Recommendation: not more than 100 objects per screen/list
Resource Consumption on Server Side
- High performance impact on backend system
- One device user is creating a backend load equivalent to one online user
- App performance is determined by server stacks and connectivity
Performance Recommendations :
App Implementation
- Smart caching mechanism is essential for good performance. Reuse configuration/customizing data
- Think about doing asynchronous prefetching of business data
- Splitting the data that is retrieved into multiple requests. Load important data first, display it and then retrieve the remaining data e.g. pictures asynchronously
- No more than two round trips in parallel, because GSM/3G networks will add because of serialization and low bandwidth a lot of response time
- Keep data volume at a minimum, recommendation is 10 KB compressed data volume per screen
Architectural Design
- App performance is determined by server stacks and network connectivity
- For optimal performance the app design has to follow the backend applications
- Keep the resource consumption in backend at a minimum to ensure good response time
Performance Tools
Tools for iOS
Instruments can be used for analysis of most of performance related issues
- Memory Leak detection
- Memory allocation
- Method Profiling
- Frame Rate of views with animations
- Battery usage
- Test Automation
Fiddler can be used for analysis of HTTP communication
For details see https://developer.apple.com/Instruments
Tools for Android
For details see https://developer.android.com/
