Introduction
With more than 7,2 billion inhabitants on our planet, and the human population growing constantly, the demand for clean drinking water is increasing rapidly.
Indirectly, water resources are also required for personal hygiene and in agriculture, in order to satisfy the increasing demand for food. Because of the great variety of areas where water is needed, the necessity of an intensive water management is indispensable. An innovative approach to water management should not only cover the way water passes from source to use but also the time and space dimension of water usage.
Geographically speaking, water is not distributed equally. Some countries have more water than they need so there is no need to save water at all, while others barely have enough to provide enough drinking water to the population and satisfy the demand of agriculture. A large-scale exchange of water between these regions is however nothing which makes sense given the current state of the art.
Therefore, water utilities are required to find approaches to save, reuse, and recycle water according to the specific circumstances of climate, ecology, and economy. However, they are also confronted with a number of issues to satisfy the growing demand. This concerns:
- The management of water quality
- The management of the water distribution network
- The monitoring and optimization (e.g. through incentives) of water usage
For this purpose, sensors such as water flow meters and pressure meters can be used to record the status of the network and monitor consumption in close to real-time. However, with some water utilities managing several million customers, some 60000 km of pipe network, more than 100 water treatment plants, and several billion liters water per day, this requires immense investments in infrastructure and IT, while utilities are not sure yet whether these will pay off. It is therefore key to identify which use cases water utilities might actually be interested in, in order to roll these out and test them with trials and prototypes.
SAP St.Gallen is developing a prototypical information system which will be rolled out in test areas in Greece, Portugal, and the UK, with all of them inheriting a very different economic and ecologic background. Involved in these test cases will also be the customers themselves, in order to let them contribute by monitoring and improving their water consumption by the use of innovative IT tools.
The first step was to identify which use cases are relevant from the perspective of the water utilities. The most important ones will be shortly highlighted in the following.
Water balance
Calculating the water balance means determining the main flows of water distribution, that is the amount of water which are pumped into a certain area or district metered area (DMA), as well as how and where the water is consumed, lost, or sent back to the cycle. However, the water balance is currently only calculated on a quarterly or annual basis. Additionally, some values are only estimated or calculated using a poor data basis, e.g. from manually taken meter readings. As a consequence, a real monitoring or optimization of the system based on the water balance is not possible. The developed prototype is fed by smart meters which send a signal every 15 minutes, allowing for almost real-time calculation of the water balance. With this data basis, technicians can analyze the water consumption for every DMA and detect anomalies, inefficiencies in the water distribution network, and illegal water use much better, but also forecast and plan their revenues and pricing strategy, for example. The huge amount of data requires the use of smart algorithms such as neural-network-based approaches, domain knowledge, and the use of state of the art IT. At this level, SAP technologies such as SAP HANA provide an enormous potential. Figure 1 shows how the water balance table was implemented in the current version of the prototype. It is based on an IBM DB2 database due to contractual obligations with the project partners. First internal test however showed a speed improvement of factor 100 and more by the use of SAP HANA without much code-level optimization.
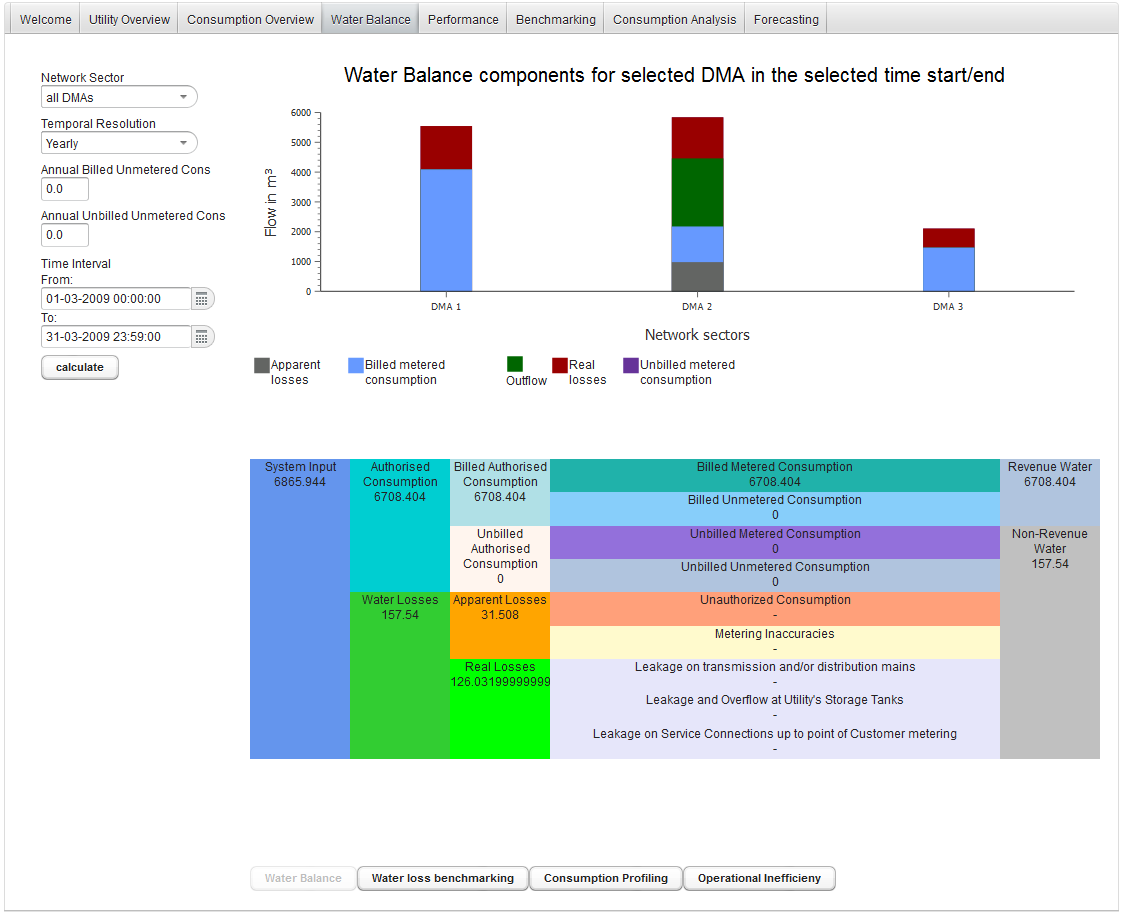
Figure 1: Water balance table in iWidget prototype
Monitoring of network and infrastructure inefficiencies
Water distribution networks were usually planned based on outdated assumptions about population, consumption behavior and peaks, and sometimes even water reservoirs. They are updated whenever a need for change becomes evident. Closely observing the water distribution infrastructure not only allows companies to better plan pumping schedules, infrastructure investments, water treatment plans and reservoirs, they can also avoid unnecessary investments and detect inefficiencies. In particular important is the detection of background leakage and pipe bursts, which lead to a large increase in the non-revenue water and therefore correspond to costs which are not related to any increase in revenue. Therefore, they directly affect the profitability of the company, which is why this use case is a good lever to convince water utilities of trials to improve the network monitoring by the use of smart metering and IT. Figure 2 illustrates how some of the major water flows in several DMAs are visualized in the current version of the prototype.
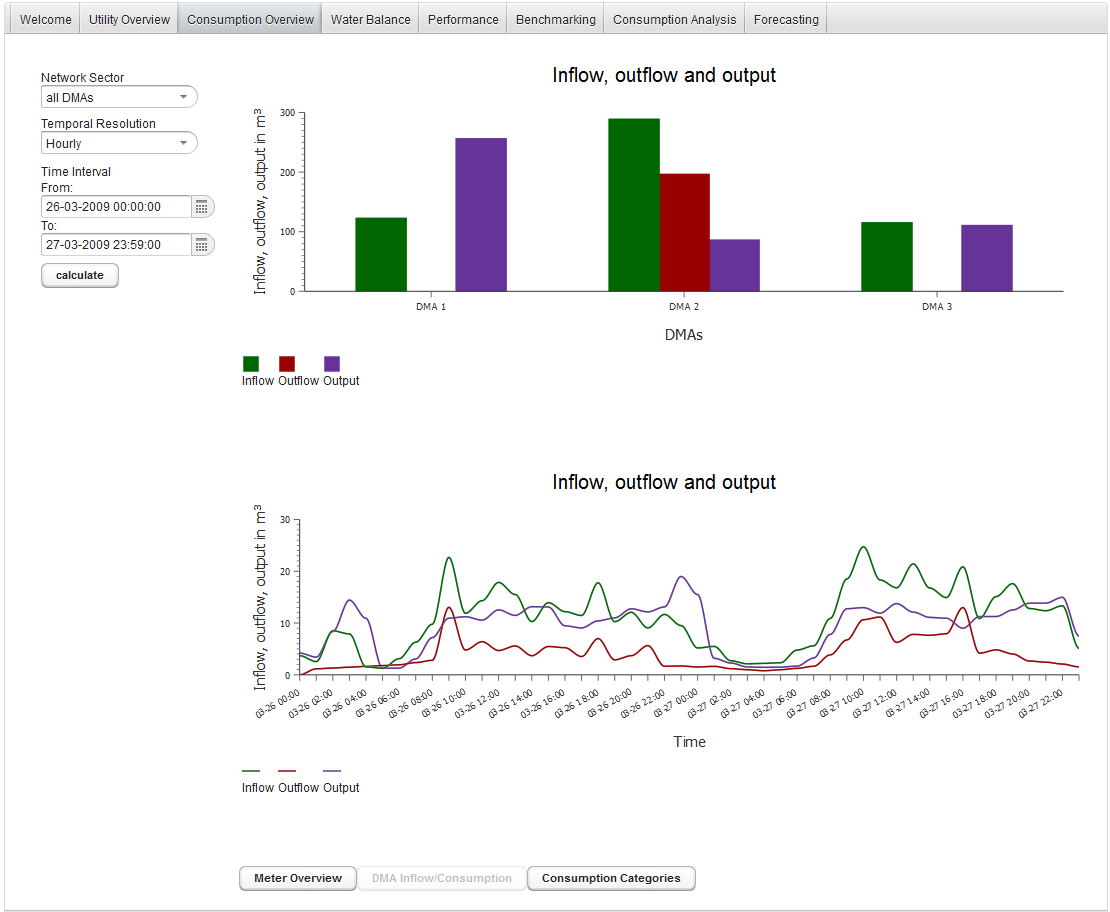
Figure 2: DMA consumption overview in iWidget prototype
Consumption profiling
Water consumption widely varies with the season, the weather, the weekday (not to forget holidays), the specific area, the financial status and the age of the customer, the household size, and many more influence variables. However, most water utilities do not know much about the behavior of their customers on a micro-level. On a macro-level they do know that, on a hot summer day, especially on the weekend, water consumption will significantly go up due to customers watering their gardens and using their pools. The have also learned that water usage peaks will be much later on the weekend and during holidays. But in order to really understand their customers, they need to study water consumption behavior for interesting subgroups, so they can better plan their network, and offer (e.g. add-on) services and a pricing which lets them run the network at reduced costs and/ or increase revenue. Water consumption analysis is the means to do so, and by monitoring subgroup consumption behavior in close to real time, water consumption profiling can be taken to the next level and also allows for observing and analyzing the results of test runs in customer efficiency programs or other improvement efforts. Figure 3 shows the current status of the implementation of the consumption profiling use case in the prototype.

Figure 3: Consumption profiling in iWidget prototype
The research was carried out as part of the European research project “iWidget”. This project has received funding from the European Union’s Seventh Framework Programme for research, technological development and demonstration under grant agreement no 318272. This publication reflects only the author's views and the European Union is not liable for any use that may be made of the information contained therein.
In case you are interested to learn more about the iWidget prototype, please contact christine.grimm@sap.com.
