
- SAP Community
- Products and Technology
- Technology
- Technology Blogs by SAP
- Analyzing E2E performance using Introscope Transac...
Technology Blogs by SAP
Learn how to extend and personalize SAP applications. Follow the SAP technology blog for insights into SAP BTP, ABAP, SAP Analytics Cloud, SAP HANA, and more.
Turn on suggestions
Auto-suggest helps you quickly narrow down your search results by suggesting possible matches as you type.
Showing results for
Advisor
Options
- Subscribe to RSS Feed
- Mark as New
- Mark as Read
- Bookmark
- Subscribe
- Printer Friendly Page
- Report Inappropriate Content
04-17-2014
7:48 PM
Sometimes understanding exactly what part of a particular workflow is contributing to slow response times can be challenging. In the BI Platform landscape, there are many components and variables which contribute to the response times that end users are experiencing. Thanks to the tight integration of SAP BI Platform 4.x and CA APM Introscope, we have a very useful and powerful tool that we can use to see under the hood and provide response times for very granular aspects of the reporting workflow. This tool is the Transaction Tracer and is included in the set of monitoring and diagnostic tools that Introscope provides. The Transaction Tracer is a feature of the Introscope Workstation that allows you to record transactions across the landscape and then filter these transactions based on SAP Passport which is generated by the SAP Client Plug-in. After the trace is generated and filtered, the data can be quickly analyzed in great detail using the Workstation's rich graphical user interface.
In this article, I will demonstrate how to generate and analyze an end to end trace using the Introscope Transaction Tracer and SAP Passport without the use of SAP Solution Manager. In place of SAP Solution Manager, the SAP BI Platform Support Tool (a free utility for BI administrators) will provide the capabilities needed to generate the query which will be submitted to Introscope. If you are interested in this topic but are instead using SAP Solution Manager (rather than CA APM Introscope in stand-alone mode), check out this wiki page for a tutorial. If you do not have Introscope configured for BI Platform 4.x yet and are looking for instructions and a tutorial, refer to the following article A complete guide to setup CA APM Introscope 9 for monitoring SAP BI Platform 4.1 on Windows [PART 1/...
Validate that metrics are being collected
The first step that should be done prior to generating the trace is to confirm that all the necessary metrics are being collected for the workflow you are tracing. In this example, we will be tracing the time that it takes to refresh a Web Intelligence document against the E-fashion database. We can use the provided BOE 4.0 Introscope dashboards to confirm that metrics are being collected for the agents that belong to the landscape that we want to trace. If you plan to trace some other workflow and are not sure which BI components are involved, you can refer to the official BI 4.x product tutorials for guidance. See below an example of the Webi Refresh workflow and the Introscope dashboards we need to check:

- Launch the CA Introscope Workstation using the URL http://IEMHOST:8081/workstation and logon to the Introscope Enterprise Manager (where IEMHOST is your CA APM Introscope Enterprise Manager hostname and 8081 is the HTTP port)
- Click Workstation, new Workstation
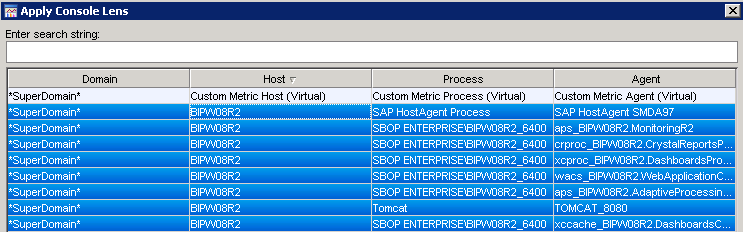
- Click the LENS button and sort by host, then multi-select all the hosts that belong to the BI landscape where you are performing the E2E trace and click APPLY. This will filter out all the un-necessary metrics and allow us to confirm that we are seeing metrics from the hosts involved in our workflow
- Next, click the dashboards drop-down and select the BOE 4.0 WEBI WAS dashboard

- Confirm that you are seeing metrics for the Webi Web Application dashboards

- Repeat steps 1-5 for each of the dashboards that are relevant to the workflow you are tracing. If you are unsure of which dashboards should be checked, refer to the BI4 RCA guide for detailed descriptions of each dashboard. Also, if you find that metrics are missing, refer back to the configuration guide and confirm that the Introscope Agents were configured correctly. For support on this topic, open an incident under component BI-BIP-DEP.
In this example, the dashboards to check include:- Apache Tomcat Dashboard
- BOE 4.0 WEBI WAS
- BOE 4.0 PLATFORM SDK- BOE 4.0 WEBI SERVER DETAIL
- BOE 4.0 WEBI SERVER OVERVIEW
Execute the E2E Trace
The SAP Client Plug-in is used to launch the browser and send the necessary header variables which will instruct Introscope to automatically record the Transaction Trace on the Introscope Enterprise Manager. The benefit of using the SAP Client Plug-in is that you do not need to manually start/stop the Transaction Trace tool inside Introscope Workstation which greatly simplifies the workflow. Download the SAP Client Plug-in according to your browser version and close all browsers before continuing with this section. Refer to the table below:
| VERSION | PLUG-IN DOWNLOAD | SAP NOTE |
| Internet Explorer 8, 9, 10 | SAPClientPlugin_1.26_x86.zip | SAP NOTE 1435190 |
| Internet Explorer 11 | SAPClientPlugin.rar | SAP NOTE 1608231 |
- First, on the client where you will be executing the trace, make sure that all browsers are closed (it's also a good idea to check task manager and end task on all iexplore.exe processes)
- Browse to the location where you downloaded and extracted the SAP Client Plug-in and right click on plugin-starter-gui.exe and choose Run as administrator

- Confirm that Application is set to Microsoft Internet Explorer and click Launch

- After Internet Explorer launches, return to the SAP Client Plug-in and give the Business Transaction Name property a meaningful name and change the Next Step TraceLevel property to Medium. The Transaction Trace is programatically enabled on the Introscope Enterprise Manager when the SAP Passport is detected and the tracelog level is set to MEDIUM or HIGH)
- Next, queue up your browser to the place in the application where you want to begin tracing. In this simple example, we will trace a Web Intelligence refresh. When you are ready to begin the Transaction Trace, click the Start Transaction button on the SAP Client Plug-in then proceed with your workflow. Confirm the trace is working by checking the Sent Bytes / Recieved Bytes. When the trace is completed both should have values other than 0.

- When you have completed your workflow, click the Stop Transaction button then click ok on message "Please upload BusinessTransaction.xml manually"
Decode the SAP Passport with the BI Platform Support Tool
The key to fetching the E2E traces from Introscope Transaction Tracer is to decode the SAP Passport and query the Introscope Enterprise Manager for the historical trace records. To decode the SAP Passport from the BusinessTransaction.xml, you must use the new SAP Passport Decoder tool which is included in the SAP BI Platform Support Tool version 1.1.5 or higher. Download the tool from this wiki page
- Launch the SAP BI Platform Support Tool (v 1.1.5 or higher)
- From the menu, click Tools, then click SAP Passport Decoder

- Next click Browse, then browse to the location where your BusinessTransaction.xml is stored (this can be found in the /log/transactionName folder on the client where you extracted and ran the SAP Client Plug-in from). For example, C:\sapclientplugin\log\20140417_090959_Refresh Webi Document
- Notice that all of the information required to view the Transaction Trace has been extracted and decoded for you from the uploaded BusinessTransaction.xml

Query the E2E workflow in Introscope Transaction Tracer
Now that you have decoded the SAP Passport, you can now query for the Transaction Traces inside the Introscope Workstation
- Launch the Introscope Workstation
- Click on Workstation then Query Historical Events

- Next, click the drop-down box next to Time range and select Custom Range then set the time range according to the start and stop time in the SAP Passport Decoder tool then click ok. Make sure you specify a few minutes before and after the specified start/stop time to ensure you query for all the transactions that were part of your E2E workflow.

- Finally, copy the Introscope query from the SAP Passport Decoder tool into the Events Query box inside the Historical Query Viewer and click the GO button to execute the query

- The E2E Transaction Trace results are shown only for the workflow that you recorded using the SAP Client Plug-in
Analyze the E2E workflow in Introscope Transaction Tracer
- To begin the E2E analysis, first click the Timestamp column and make sure that the timestamps are sorted in ascending order then press CTRL-A or multi-select all of the transaction events in the Historical Query Viewer

- To view the most expensive methods and transactions for this recorded workflow, click the Summary View tab, then click the Call time (ms) column to sort descending. In this example, the processDPCommandsEx( ) method took the most processing time (2 calls at 1.7 seconds each)

- To analyze the E2E workflow in a heirachical callstack format to understand where a bottleneck might be, click the Tree View tab. Notice, in this view we can drill-down into the processDPCommandsEx( ) method to see which methods called by processDPCommandsEx( ) actually consumed the most time

- To view the E2E trace in a timeline format, click the Trace View tab. Notice, clicking on specifc methods reveals parameters passed into the method

- SAP Managed Tags:
- SAP BusinessObjects Business Intelligence platform
- 4.0
- administration
- analysis
- analytics
- bi platform
- bi support tool
- bi4 upgrade
- bi4.0
- bi4.1
- bobj
- business intelligence
- business intelligence (businessobjects)
- business objects dashboards
- businessobjects
- diagnostics
- e2e diagnostics
- e2e trace analysis
- rca
- root cause analysis
- sap businessobjects business intelligence platform 4.0
- SAP Businessobjects Web Intelligence 4.0
- sapclientplugin
- troubleshooting
- wily
- wily introscope
20 Comments
You must be a registered user to add a comment. If you've already registered, sign in. Otherwise, register and sign in.
Labels in this area
-
ABAP CDS Views - CDC (Change Data Capture)
2 -
AI
1 -
Analyze Workload Data
1 -
BTP
1 -
Business and IT Integration
2 -
Business application stu
1 -
Business Technology Platform
1 -
Business Trends
1,658 -
Business Trends
93 -
CAP
1 -
cf
1 -
Cloud Foundry
1 -
Confluent
1 -
Customer COE Basics and Fundamentals
1 -
Customer COE Latest and Greatest
3 -
Customer Data Browser app
1 -
Data Analysis Tool
1 -
data migration
1 -
data transfer
1 -
Datasphere
2 -
Event Information
1,400 -
Event Information
66 -
Expert
1 -
Expert Insights
177 -
Expert Insights
299 -
General
1 -
Google cloud
1 -
Google Next'24
1 -
Kafka
1 -
Life at SAP
780 -
Life at SAP
13 -
Migrate your Data App
1 -
MTA
1 -
Network Performance Analysis
1 -
NodeJS
1 -
PDF
1 -
POC
1 -
Product Updates
4,577 -
Product Updates
344 -
Replication Flow
1 -
RisewithSAP
1 -
SAP BTP
1 -
SAP BTP Cloud Foundry
1 -
SAP Cloud ALM
1 -
SAP Cloud Application Programming Model
1 -
SAP Datasphere
2 -
SAP S4HANA Cloud
1 -
SAP S4HANA Migration Cockpit
1 -
Technology Updates
6,873 -
Technology Updates
422 -
Workload Fluctuations
1
Related Content
- IoT - Ultimate Data Cyber Security - with Enterprise Blockchain and SAP BTP 🚀 in Technology Blogs by Members
- Analyze Expensive ABAP Workload in the Cloud with Work Process Sampling in Technology Blogs by SAP
- Unify your process and task mining insights: How SAP UEM by Knoa integrates with SAP Signavio in Technology Blogs by SAP
- SAP Build Code - Speed up your development with Generative AI Assistant - Joule in Technology Blogs by SAP
- plug and gain 101: #4 What is a Process Flow Variant? in Technology Blogs by SAP
Top kudoed authors
| User | Count |
|---|---|
| 40 | |
| 25 | |
| 17 | |
| 13 | |
| 7 | |
| 7 | |
| 7 | |
| 6 | |
| 6 | |
| 6 |