I have seen quite a few blogs in this channel and showing the capabilities of Lumira on discovering insights with a single data set. Fantastic job by many of the members.
With this blog i wanted to show the capabilities of SAP Lumira in how you can combine multiple data sources and visualize them.
For the usecase i choose the dataset from grouplens project (1 million rows, 12 columns)
There are three data files and a readme.txt

Now the contents in the file, from "readme.txt"
| users.csv | - UserID::Gender::Age::Occupation::Zip-code |
| ratings.csv | - UserID::MovieID::Rating::Timestamp |
| movies.csv | - MovieID::Title::Genres |
Lets now go ahead and acquire these files in SAP Lumira
After launching i choose new document

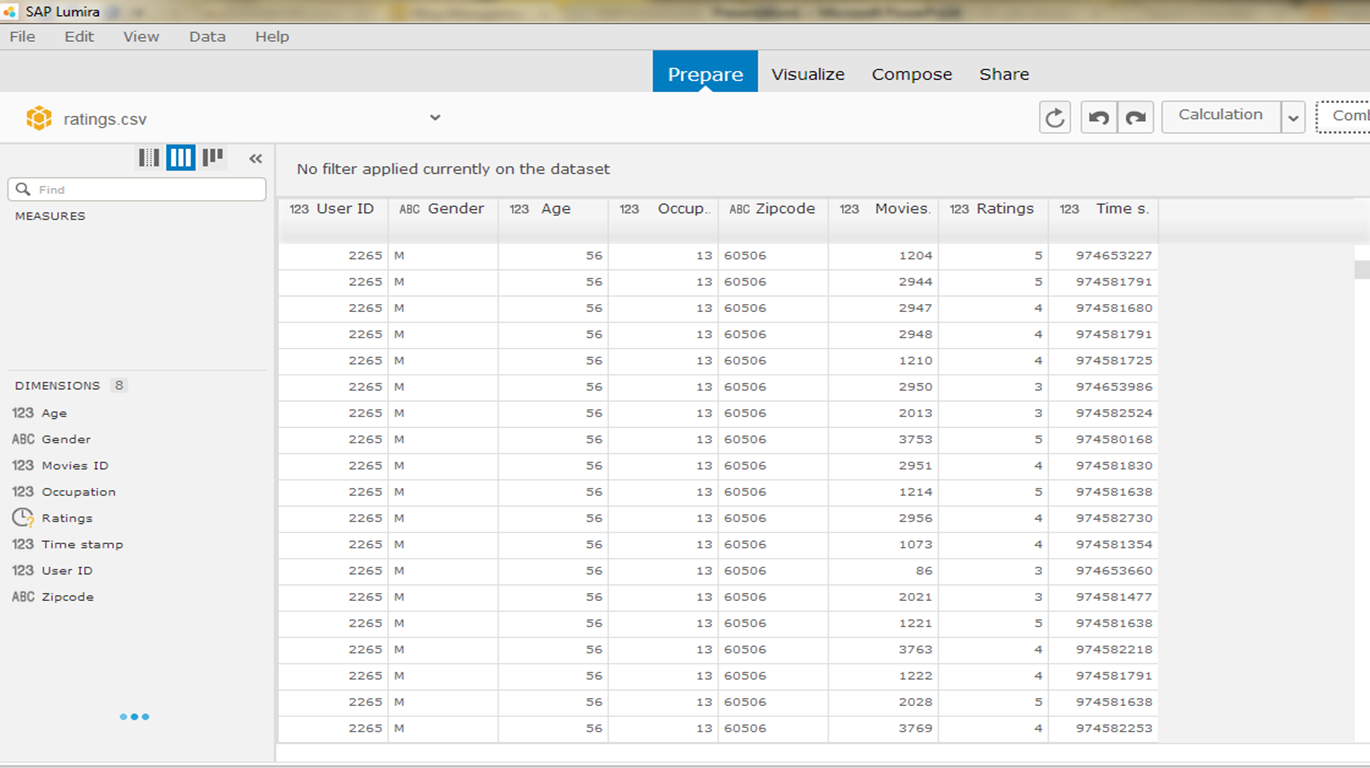
I first acquires the ratings.csv file and choose only the relevant columns

Then i rename the columns to appropriate names as the original csv files don't have header information.

Then i repeat the same steps of acquisition and renaming the columns for the rest of the two files
users.csv

movies.csv

Now i am done acquiring all the 3 files (ranking, movies & users) into SAP Lumira

Now we will merge these files.
Rules of merge as per documentation
- The merging dataset must have a key column.
- Only columns with the same data type are considered.
- The merge adds all columns.
So i go ahead and choose rankings.csv as my base file and then first add users data
In the prepare room i choose combine as --> Merge

and choose users.csv and define the mapping as User ID.

Now i have merged these two datasets
I will now repeat the same thing for movies.csv file and define the mapping as movie ID and now i have a single data set which is created out of the multiple sources.
I will now create a measure on Rankings and do an aggregation on count (all)


In the next step you will see that Genre Column contains data of multiple genres separated by a Pipe (|) symbol. so we will use the SAP Lumira's manipulation capabilities to create a unique Genre values from this.
For this, we will select the column and on the right side, choose split and enter "|" as the delimiter and execute it. you will now see two additional columns added.


Now we get into the fun part. you could create different visualizations based on the combined dataset.
I got into creating #ratings by Age Group, by Gender, by Genre, Top 25 movies with a filter on Genre


Then i created a story with the Top template and loaded these visualizations. I also added a story board filter on Genre

Then I published this to SAP Lumira cloud


To summarize, you can use SAP Lumira to acquire, combine multiple sources of data and manipulate or enrich the data with SAP Lumira and then create visualizations and stories and share with your colleagues.
Please let us know if you have used this feature in SAP Lumira and what's your feedback.
Best Regards
