- SAP Community
- Products and Technology
- Supply Chain Management
- SCM Blogs by Members
- Key Figure settings for temprature in DP planning ...
- Subscribe to RSS Feed
- Mark as New
- Mark as Read
- Bookmark
- Subscribe
- Printer Friendly Page
- Report Inappropriate Content
These documents explains one of the approach to get correct temperature values in monthly and weekly planning books.
Applies to: Industries which have implemented “SAP SCM-Demand planning” (Release version from 4.1…).
Author: G.K.Radhakrishnan
G.K.Radhakrishnan (APICS-CPIM ), is working as a SAP APO-DP consultant in Accenture has a consulting experience of more than three years with a domain experience of 7years in supply chain.
Introduction: Temperature can be a variable in MLR forecast models in many industries such as beverages.The sales of soft drinks increases in summer as the temperature goes up and it reduces in winter months .So it is important to get correct temperature values in both monthly view and weekly views to generate the forecast
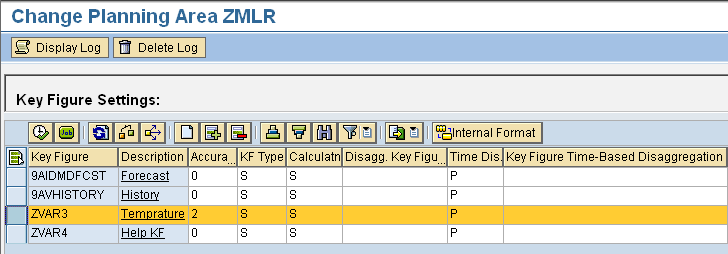
Key Figure settings
Below link provides all the details of aggregation and disaggregation of each key figure are defined by its calculation type and its time-based disaggregation type.
http://help.sap.com/saphelp_scm70/helpdata/en/47/d12b801fb26c68e10000000a42189b/frameset.htm
As shown below if we use temperature with calculation type S and Time based disaggregation P then the results are incorrect in monthly view if we get data in weeks.

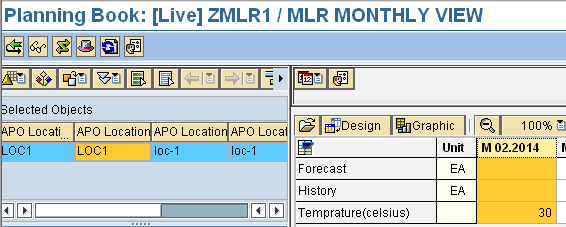
Temperature is updated at weekly level and weekly view is shown below

Temperature is shown in technical buckets below

Temperature is shown in Monthly view below.As seen it got added up and now it is not possible to run MLR in monthly view

One possible solution is to use the below settings


After making these changes if we reload data at weekly level then the results are below


Advantages of this approach
Temperature will be correct in monthly view and weekly view.This gives user the flexibility to run MLR forecast at both monthly and weekly level.
Limitations of this approach
Historical temperature and future temperatures( predictions from weather department) should be available for all the weeks with no missing data at all the locations.Else monthly numbers will be incorrect.
The approach will only show correct values if temperature is seen in location or at a drill down but it will be incorrect at aggregated level .
For example if we have a Region with two locations L1 and L2 .Location L1 has 3 CVC for Product P1,P2,P3 and Location L2 has two products P1 and P2

- SAP Managed Tags:
- SAP Advanced Planning and Optimization
You must be a registered user to add a comment. If you've already registered, sign in. Otherwise, register and sign in.
-
aATP
1 -
ABAP Programming
1 -
Activate Credit Management Basic Steps
1 -
Adverse media monitoring
1 -
Alerts
1 -
Ausnahmehandling
1 -
bank statements
1 -
Bin Sorting sequence deletion
1 -
Bin Sorting upload
1 -
BP NUMBER RANGE
1 -
Brazil
1 -
Business partner creation failed for organizational unit
1 -
Business Technology Platform
1 -
Central Purchasing
1 -
Charge Calculation
2 -
Cloud Extensibility
1 -
Compliance
1 -
Controlling
1 -
Controlling Area
1 -
Data Enrichment
1 -
DIGITAL MANUFACTURING
1 -
digital transformation
1 -
Dimensional Weight
1 -
Direct Outbound Delivery
1 -
E-Mail
1 -
ETA
1 -
EWM
6 -
EWM - Delivery Processing
2 -
EWM - Goods Movement
4 -
EWM Outbound configuration
1 -
EWM-RF
1 -
EWM-TM-Integration
1 -
Extended Warehouse Management (EWM)
3 -
Extended Warehouse Management(EWM)
7 -
Finance
1 -
Freight Settlement
1 -
Geo-coordinates
1 -
Geo-routing
1 -
Geocoding
1 -
Geographic Information System
1 -
GIS
1 -
Goods Issue
2 -
GTT
2 -
IBP inventory optimization
1 -
inbound delivery printing
1 -
Incoterm
1 -
Innovation
1 -
Inspection lot
1 -
intraday
1 -
Introduction
1 -
Inventory Management
1 -
Localization
1 -
Logistics Optimization
1 -
Map Integration
1 -
Material Management
1 -
Materials Management
1 -
MFS
1 -
Outbound with LOSC and POSC
1 -
Packaging
1 -
PPF
1 -
PPOCE
1 -
PPOME
1 -
print profile
1 -
Process Controllers
1 -
Production process
1 -
QM
1 -
QM in procurement
1 -
Real-time Geopositioning
1 -
Risk management
1 -
S4 HANA
1 -
S4-FSCM-Custom Credit Check Rule and Custom Credit Check Step
1 -
S4SCSD
1 -
Sales and Distribution
1 -
SAP DMC
1 -
SAP ERP
1 -
SAP Extended Warehouse Management
2 -
SAP Hana Spatial Services
1 -
SAP IBP IO
1 -
SAP MM
1 -
sap production planning
1 -
SAP QM
1 -
SAP REM
1 -
SAP repetiative
1 -
SAP S4HANA
1 -
SAP Transportation Management
2 -
SAP Variant configuration (LO-VC)
1 -
SD (Sales and Distribution)
1 -
Source inspection
1 -
Storage bin Capacity
1 -
Supply Chain
1 -
Supply Chain Disruption
1 -
Supply Chain for Secondary Distribution
1 -
Technology Updates
1 -
TMS
1 -
Transportation Cockpit
1 -
Transportation Management
2 -
Visibility
2 -
warehouse door
1 -
WOCR
1
- Integrating SAP Datasphere with SAP Integrated Business Planning, using SAP CI - Part 1 in Supply Chain Management Blogs by SAP
- Change "Take Safety Stock into Account" setting in 000 planning version in Supply Chain Management Q&A
- SAP S/4HANA 2023 FPS1: Improved integration of purchase scheduling agreements with TM in Supply Chain Management Blogs by SAP
- Highlights of Transportation Management in SAP S/4HANA Cloud Private Edition 2023 (FPS01) in Supply Chain Management Blogs by SAP
- Migration to SAP S/4HANA Transportation Management in Supply Chain Management Blogs by SAP
| User | Count |
|---|---|
| 3 | |
| 2 | |
| 2 | |
| 1 | |
| 1 | |
| 1 | |
| 1 | |
| 1 |