
- SAP Community
- Groups
- Industry Groups
- SAP for Utilities
- Blogs
- Research on Smart Water Management: First Prototyp...
SAP for Utilities Blogs
Discover insights and practical tips to optimize operations, reduce costs, and deliver reliable energy with SAP technology. Contribute your own blog post!
Turn on suggestions
Auto-suggest helps you quickly narrow down your search results by suggesting possible matches as you type.
Showing results for
Former Member
Options
- Subscribe to RSS Feed
- Mark as New
- Mark as Read
- Bookmark
- Subscribe
- Printer Friendly Page
- Report Inappropriate Content
01-27-2014
11:20 AM
One of the most significant barriers to promoting efficient water-energy use in water distribution systems is insufficient supply of data about water and related energy consumption in the network and at consumer sites. This poses a challenge to policy-makers and regulators when trying to determine appropriate measures to promote efficiency for either context and to help consumers understanding and improving their water consumption habits. Smart meter technologies grant access to real-time data and to the history of water usage by consumers and utilities. This data allows for identification of when and how much water was respectively is being consumed, as well as opportunities for efficiency improvements, namely efficient water use in the household and utility-level control of water losses and cost-benefit water planning.
These challenges are currently under research in the context of the EU-funded research project iWIDGET (http://www.i-widget.eu/). As the first year of this three years project has already passed, this blog post intends to give a short summary and insight to preliminary results including the selection of use cases, which are of prime interest for water utilities.
The EU-funded project iWIDGET
The aim of the EU-funded iWIDGET (Improved Water efficiency through ICT technologies for integrated supply-Demand side manaGEmenT) project is to advance knowledge and understanding of smart metering technologies in order to develop novel, robust, practical and cost-effective methodologies and tools to manage urban water demand in households across Europe, by reducing wastage, improving utility understanding of end-user demand and reducing customer water and energy costs. The main scientific challenges for iWIDGET are the management and extraction of useful information from vast amounts of high-resolution consumption data, the development of customised intervention and awareness campaigns to influence behavioural change, and the integration of iWIDGET concepts into a set of decision-support tools for water utilities and consumers, applicable in differing local conditions.
In order to meet these aims and challenges, iWIDGET will investigate: (1) how best to provide the dynamic accurate measurement and data transfer of useful information about end-user water consumption, (2) how best to use consumption data to improve the operation of utilities and influence end-users to modify their behaviour, (3) how to arrive at the best business model to convert a promising technology into a useful and cost-effective product, and (4) how to demonstrate and validate the new methodologies on two case studies in the North and South of Europe.
The project consortium consists of partners from all over Europe, and combines Universities, industrial partners and pilot companies (water utilities):
- University of Exeter, UK
- HR Wallingford LTD, UK
- IBM Ireland
- Laboratorio Nacional de Engenharia Civil, PT
- Nacional Technical University of Athens, GR
- SAP (Switzerland) AG, CH
- Utility Partnership LTD, UK
- AGS- ADMINISTRACAO E GESTAO DE SISTEMAS DE SALUBRIDADE AS, PT
- Waterwise Project LTD, UK
- Southern Water, UK
iWIDGET Use Cases
A major activity in the first year of the project was the development of interesting and appropriate use cases, which should cover a broad scope of applications that build upon exploitation of data related to water and energy usage in water distribution systems and consumer households. These use cases are considered important current challenges of water utilities and are intended to serve as basis for the development of solutions by the project partners.
In order to obtain a comprehensive list of possible use cases, the following methodology was used. First, a list of high-level use cases was compiled, described and harmonized. High-level use cases were used to describe the main process in iWIDGET system and were aligned with the project objectives. For each high-level use case, a list of detailed-level use cases was subsequently compiled, described and harmonized. Detailed-level use cases exhaustively describe the sub-processes within a given high-level case. At a second stage, the proposed high-level use cases were validated and prioritized, based on the contributions of two different target audiences - the project partners and dedicated stakeholders. In step three, the use cases were revised for relevance to the project and technical feasibility.
In the following the resulting high level use cases are briefly described. Two domains are differentiated for the uses cases, the consumer domain and the water utility domain (Use cases and descriptions are adapted from the project document iWIDGET Task 1.2 Use Case Description).
Consumer Domain:
- Use Case C1: Obtain water consumption data: This use case is devoted to the detailed monitoring of water consumption at the household level, using real-time data from smart meters. The iWIDGET system enables householders to follow the progress of their total and per appliance water consumption in real-time basis, through an advanced visual environment that incorporates many graphical abilities and features.
- Use Case C2: Understand water consumption: This use case comprises all facilities of the iWIDGET system, which enable householders to monitor and understand better the water consumption profile of their household. The system uses real-time as well as historical consumption data in order to execute and display useful comparisons. Through an advanced visual environment, the users can compare the current water consumption of their household with other neighbouring consumers, with consumers of similar characteristics, with more efficient households or with the historical consumption data of their household. This process aims to motivate users to change their wasteful behaviours. Additionally, the system assists householders to improve water efficiency of their house, by identifying the wasteful and inefficient water uses and appliances. Finally, the iWIDGET system has the ability to detect on real-time basis various faults related to water, such as bursts and leakages. The long-term water consumption trends of the household are also monitored for the detection of abnormal situations which could be linked with other factors, such as health.
- Use Case C3: Get assistance to increase water use efficiency: This use case addresses more efficient use of domestic water. The iWIDGET system can assist and motivate householders to decrease their water and energy consumption, through customised and alternative suggestions which include practices, tips and interventions. Apart from general water-saving tips, the system, based on the specific needs and characteristics of the household, can compose and perform different hypothetical but realistic scenarios, using various combinations of innovative technologies, such as water-efficient appliances, rainwater harvesting systems, greywater treatment systems, advanced gardening systems etc. For each proposed practice the system presents the profit and the cost of the implementation. One other basic function of iWIDGET is the forecasting of consumers’ next water bill
- Use Case C4: Control water use: This use case comprises some advanced functions of the iWIDGET system that assist the users to schedule the various water uses of their household, in an optimal way. The user can choose the appliances that are going to operate during the day and the system uses customised scenarios to try to schedule these appliances in a way that water/energy bills will be optimised. Moreover, the iWIDGET system can communicate remotely with smart appliances in order to control them based on the already conducted schedule. The system can also operate as a means to control the advanced water saving technologies (water harvesting systems, greywater treatment systems).
Water Utility Domain:
- Use Case W1: Obtain water consumption and related energy consumption data: The water utility has access to near real-time data about metered water and associated energy consumption. Water consumption data comes from SCADA, smart metering and includes network inflow, total metered consumption and total metered consumption per category of consumer. Associated energy consumption data comes from SCADA and is related to network pumping if it is present in the system.
- Use Case W2: Understand water consumption: The water utility receives near real-time information on the different components of metered water consumption and water losses (real losses, apparent losses, unmetered consumption).
- Use Case W3: Get support to increasing operational efficiency: The water utility receives real-time information on the effects of pressure control on consumption components, adaptive pumping scheduling regarding energy costs and consumption profiles and optimal placement of valves and flow meters on pipes in the network.
- Use case W4: Get support to increasing the quality of service: The water utility receives information on billing, complaints and potential residential leakage.
- Use Case W5: Get support to improve consumer efficient water use: The water utility receives customized suggestions on adaptive pricing schemes and awareness campaigns.
- Use Case W6: Get support for system planning and design: The water utility receives information on reliable demand forecasts considering context factors (e.g., socio-demographic, tariffs) to support decisions on network expansions and on optimal replacement period of equipments.
First Prototype
After the use cases had been developed the implementation of the iWIDGET system architecture and first prototypes commenced. In general the overall iWIDGET architecture (cf. Figure below) was divided into several components that are loosely coupled to be developed by partners independently.
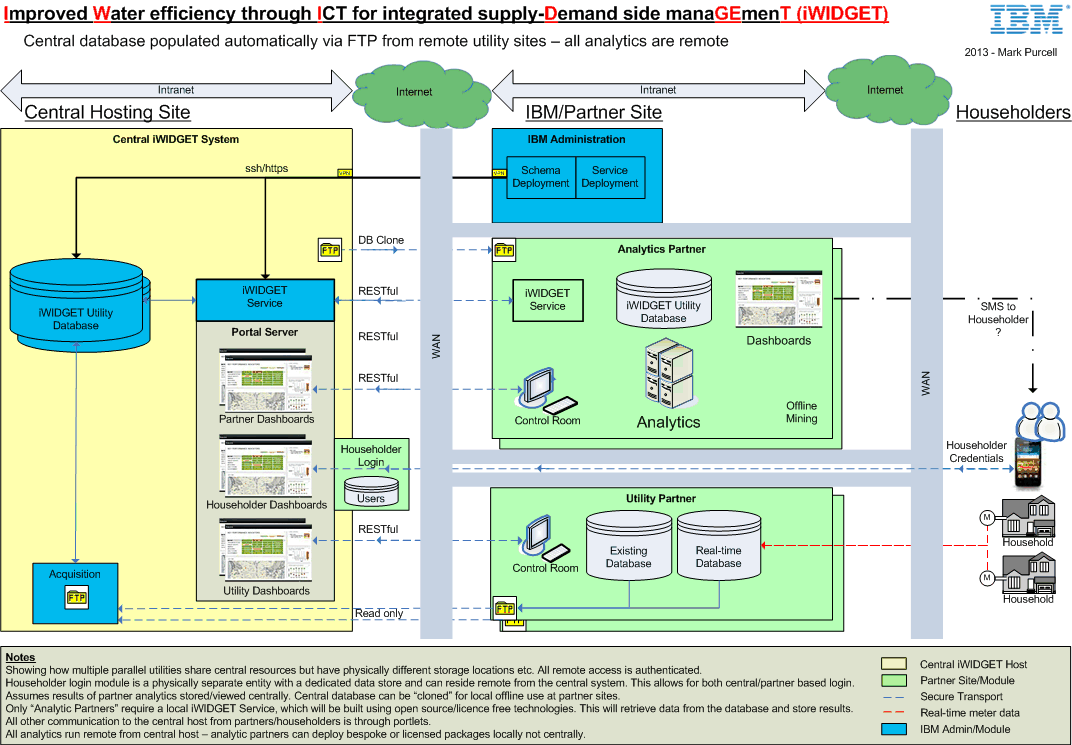
An important component is the iWIDGET central database, which provides smart meter data through a REST web service API. This data is accessed by several components also called widgets that implement the different use cases. In the context of the project SAP is responsible for use cases W1 and W2. In a first prototype the use case W1, i.e. obtain water consumption and related energy consumption data, was implemented. In this use case important consumption statistics are calculated to support a first understanding about flow and consumption data. Teh following two figures are screenshots of the developed prototype running in portlet mode. It features a two level hierarchy for navigating the different functionalities and use cases. The tabs on top represent main functionalities, which if necessary contain a secondary hierarchy at the bottom. For example the Consumption Overview tab has three different available analytic functionalities: Meter overview, DMA inflow/consumption and consumption categories. On the left hand side available filters are displayed and in the center two charts are displaying requested data. The chart on top shows totals whereas the lower chart visualizes these totals over time.

In the figure above, the meter overview analyses are presented. Here the utility staff can select a set of utility meters for analysis over time. In the data set outflow and inflow meters to DMAs are distinguished. The figure below depicts a screenshot of the DMA inflow versus consumption analyses. Inflow to DMAs can be directly compared to the consumption caused by connected residential and commercial consumers.

Technically, the prototype was implemented using only open source software available via free licences, e.g. Apache Licence, Version 2.0. In more detail the Vaadin framework (https://vaadin.com/) and the Dojo Toolkit (http://dojotoolkit.org/) were used.
For further information please contact Christine Grimm (Project Lead, iWidget)
Disclaimer: This blog post is mainly based on the document iWIDGET Task 1.2 Use Case Description.
- SAP Managed Tags:
- Utilities
You must be a registered user to add a comment. If you've already registered, sign in. Otherwise, register and sign in.
Labels in this area
-
customer centricity
1 -
cx
1 -
Life at SAP
2 -
Master Data
1 -
newsletter
1 -
Product Updates
2 -
Roadmap
1 -
S4 HANA
1 -
S4 HANA On-Premise
1 -
Utilities
2 -
utilities event
1