
- SAP Community
- Products and Technology
- Technology
- Technology Blogs by SAP
- SAP BusinessObjects Dashboards and Reports for SAP...
Technology Blogs by SAP
Learn how to extend and personalize SAP applications. Follow the SAP technology blog for insights into SAP BTP, ABAP, SAP Analytics Cloud, SAP HANA, and more.
Turn on suggestions
Auto-suggest helps you quickly narrow down your search results by suggesting possible matches as you type.
Showing results for
Product and Topic Expert
Options
- Subscribe to RSS Feed
- Mark as New
- Mark as Read
- Bookmark
- Subscribe
- Printer Friendly Page
- Report Inappropriate Content
01-15-2014
12:20 PM
For the SAP Hybris Marketing rapid-deployment solution additional SAP BusinessObjects content is available to enrich the standard analyses delivered with the Marketing Insight solution that is part of the SAP Hybris Marketing product.
The following additional SAP BusinessObjects dashboards and reports can be downloaded from the SAP Service Marketplace, and there is a detailed configuration guide available explaining how to use them as part of SAP Hybris Marketing:
Customer 360
The Customer 360 dashboard provides a 360 degree view of a customer's key performance metrics with the capability to drill to more detail where metrics KPI values are available. It is a vital dashboard that enables sales managers or sales representatives to be guided on products that they recommend to sell, alerts for action and an understanding of performance and trends in preparation for customer engagement and communication. A user can answer questions like "Which products should I recommend to my customer and what level of revenue and margin should I aim for", "What is the projected revenue performance compared to last year", "What is my customer's revenue and pocket margin and what discounting have we been offering recently", "What are my most recent interactions with my customer", etc.
Here is a sample screenshot of the Customer 360 dashboard:

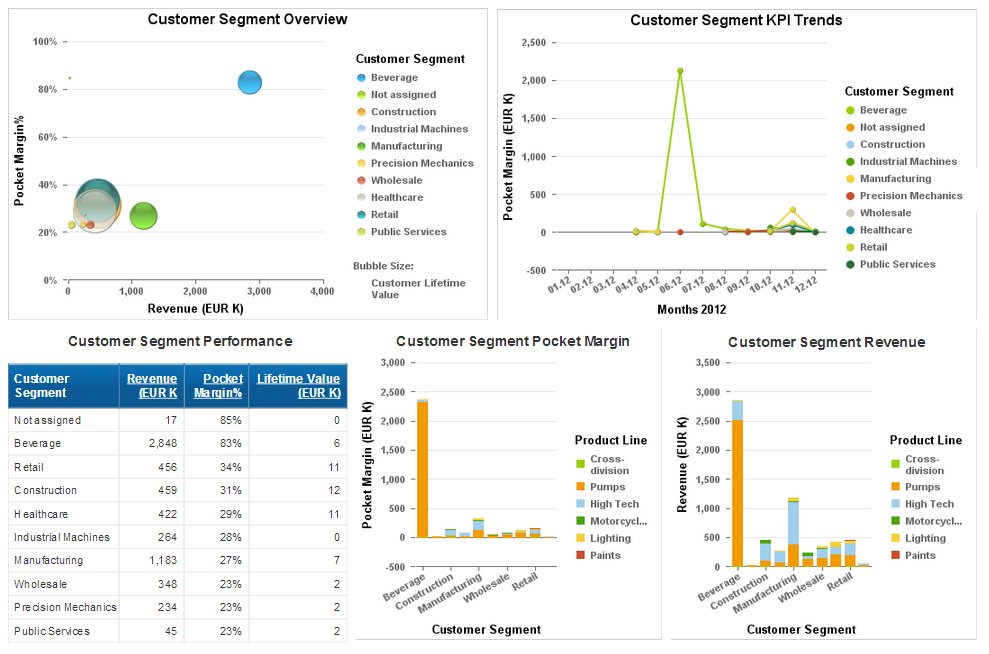
Customer Segment Performance
The Customer Segment report displays performance of customer segments. This analysis enables the marketing or sales users to view the comparative revenue and margin performance between the customer segments of a company. There is also an analysis showing comparative pocket margin trend between customer segments, and the capability to compare the product line mix by customer segments. The user can drill to a contribution dashboard to see the customer contribution to margin performance. A user can answer questions like "What is the comparative revenue and margin performance between customer segments", "Which customer segments are the least/most profitable and produce the least/most revenue in the last period", etc.
Here is a sample screenshot of the Customer Segment Performance report:
Sales Organization Performance
The Sales Organization report displays performance of sales organizations. This analysis enables sales executives and other users to view the comparative revenue and margin performance between the sales organizations of a company. There is also an analysis showing the comparative pocket margin trend between sales organizations and the capability to compare the product line mix by sales organizations. The user can drill to a contribution dashboard to see the customer contribution to margin performance. A user can answer questions like "Which sales organizations have declining/increasing pocket margin over time", "What is the product line mix of my top or bottom performing sales organization?", etc.
Channel Performance
The Channel report displays performance of channels. This analysis enables the marketing or sales users to view the comparative revenue and margin performance between the channels of a company. There is also an analysis showing comparative pocket margin trend between channels and the capability to compare the product line mix by channels. The user can drill to a contribution dashboard to see the customer contribution to margin performance. A user can answer questions like "Which channels contribute the most to pocket margin performance", "What is the comparative revenue and margin performance between channels", etc.
Discount Analysis
This report shows the discounting performance of customer segments, sales organizations, and channels. The user can understand which customer segment, sales organization, or channel receives the highest discount percentage, the associated margin percentage, and revenue. A user can answer questions like "Which customer segment, sales organization, or channel gives the highest/lowest discount percentage", "Do high levels of discount percentage coincide with high revenue", etc.
Margin Decomposition
The Margin Decomposition dashboard uses gross revenue to chart how discounts, surcharges, or costs contribute to the pocket margin. These contributions can be measured at customer segment, sales organization, or channel level. The customer segment profit and loss tabular report enables the user to see customer segment performance benchmarked compared to all segment performance. The sales or marketing user can see the same benchmarked analysis for sales organization or channel. A user can answer questions like "Which cost percentage or discount percentage, if changed, would significantly impact pocket margin percentage", "Is the invoice discount percentage significantly different for my sales organization compared to all sales organization invoice discount percentage", etc.
Here is a sample screenshot of the Margin Decomposition dashboard:

Customer Margin Decomposition
The Customer Margin Decomposition dashboard uses gross revenue to chart how discounts, surcharges, or costs contribute to the pocket margin. The customer profit and loss tabular analysis enables the sales manager or sales representative to see customer performance benchmarked compared to the customer parent - customer segment performance. A user can answer questions like "Which customer has had declining/increasing revenue, margin percentage or invoice discount percentage over time", "Is my customer invoice discount percentage significantly different from the invoice discount of the customer's parent customer segment", etc.
SAP Service Marketplace Content
Customers and partners can download the file containing the dashboards and reports on the SAP Service Marketplace. Refer to the rapid-deployment solution's release information note for download instructions: https://launchpad.support.sap.com/#/notes/1820507/E. The SAP Support Portal requires access rights.
The detailed configuration guide that describes how to implement the dashboards and reports is called SAP BusinessObjects Reports for Hybris Marketing (CEO). Customers and partners can find it on the SAP Service Marketplace which requires access rights. Use this navigation: https://service.sap.com/rds-ymkt
- SAP Managed Tags:
- SAP NetWeaver
- accelerated application delivery for sap netweaver
- analytics
- business intelligence
- business objects dashboards
- CEI
- crm sales
- Customer
- customer value intelligence
- dashboards
- HANA
- hybris
- hybris marketing
- rapid deployment
- rapid deployment solution
- rapid deployment solutions
- rds
- Retagging Required
- sap bi platform
- sap business objects
- sap business objects dashboards
- sap business objects web intelligence
- sap customer engagement intelligence
- sap hybris marketing
- SAP Rapid Deployment Solutions
3 Comments
You must be a registered user to add a comment. If you've already registered, sign in. Otherwise, register and sign in.
Labels in this area
-
ABAP CDS Views - CDC (Change Data Capture)
2 -
AI
1 -
Analyze Workload Data
1 -
BTP
1 -
Business and IT Integration
2 -
Business application stu
1 -
Business Technology Platform
1 -
Business Trends
1,658 -
Business Trends
91 -
CAP
1 -
cf
1 -
Cloud Foundry
1 -
Confluent
1 -
Customer COE Basics and Fundamentals
1 -
Customer COE Latest and Greatest
3 -
Customer Data Browser app
1 -
Data Analysis Tool
1 -
data migration
1 -
data transfer
1 -
Datasphere
2 -
Event Information
1,400 -
Event Information
66 -
Expert
1 -
Expert Insights
177 -
Expert Insights
293 -
General
1 -
Google cloud
1 -
Google Next'24
1 -
Kafka
1 -
Life at SAP
780 -
Life at SAP
13 -
Migrate your Data App
1 -
MTA
1 -
Network Performance Analysis
1 -
NodeJS
1 -
PDF
1 -
POC
1 -
Product Updates
4,577 -
Product Updates
340 -
Replication Flow
1 -
RisewithSAP
1 -
SAP BTP
1 -
SAP BTP Cloud Foundry
1 -
SAP Cloud ALM
1 -
SAP Cloud Application Programming Model
1 -
SAP Datasphere
2 -
SAP S4HANA Cloud
1 -
SAP S4HANA Migration Cockpit
1 -
Technology Updates
6,873 -
Technology Updates
417 -
Workload Fluctuations
1
Related Content
- What’s New in SAP Analytics Cloud Release 2024.07 in Technology Blogs by SAP
- Recap — SAP Data Unleashed 2024 in Technology Blogs by Members
- SAP Business AI : Infuse AI in applications using SAP BTP (with some Use Cases) in Technology Blogs by SAP
- What’s New in SAP Analytics Cloud Release 2024.02 in Technology Blogs by SAP
- クラウド時代のSAPのIDとアクセス管理ソリューションのご紹介 in Technology Blogs by SAP
Top kudoed authors
| User | Count |
|---|---|
| 35 | |
| 25 | |
| 13 | |
| 7 | |
| 7 | |
| 6 | |
| 6 | |
| 6 | |
| 5 | |
| 4 |