
- SAP Community
- Products and Technology
- Technology
- Technology Blogs by SAP
- Optimize the performance of your SAP BusinessObjec...
Technology Blogs by SAP
Learn how to extend and personalize SAP applications. Follow the SAP technology blog for insights into SAP BTP, ABAP, SAP Analytics Cloud, SAP HANA, and more.
Turn on suggestions
Auto-suggest helps you quickly narrow down your search results by suggesting possible matches as you type.
Showing results for
Former Member
Options
- Subscribe to RSS Feed
- Mark as New
- Mark as Read
- Bookmark
- Subscribe
- Printer Friendly Page
- Report Inappropriate Content
11-29-2013
10:22 AM
Optimize the performance of your
SAP BusinessObjects Design Studio solutions – tips and tricks
SAP BusinessObjects Design Studio allows you to build solutions on SAP Netweaver, SAP HANA and with the new version 1.2 on BusinessObjects Universes. With the technical possibility to create very advanced dashboards, one of the main criteria driving the End User adoption is performance: whatever you may bring into these dashboards in terms of content and nice design, you will get the buy-in you are looking for only with a very high interactivity, there is no time to wait !
After a first blog on Design Tips and Tricks, here is a second article that specifically deals with performance. Based on our experience with real implementations (SAP Runs SAP), we have collected and documented a list of things to do to make sure our Design Studio Apps are optimized to offer the highest responsiveness!
Note: for each item in the list below, we have made an assessment on the potential performance improvement. This potential is an indicator, it does not mean it systematically brings the same percentage of speed growth, as there are many parameters entering into the overall results.
Disclaimer: all information below are the result of investigation made by myself and some other colleagues from the team. There is no commitment from SAP regarding the points below. We just want to share our point of view, our investigations about how we have improved our performance.
1. PageBooks and Tabs – management of the initial view
–> Performance improvement potential : very high
This is the most important of all of the aspects! With a careful handling of such design configurations, you can drastically influence the perception at each navigation step.
When your app includes Tabs or Pagebooks, this means that there are several “screens” where only one is active and visible. Therefore, only the data sources on this active screen (page or tab) should be processed.
- When leaving this active view, “Resetting” the corresponding data sources should not be done (the screen it not visible anyway).
- All the data sources of the other inactive views should not be the object of any action as long as these views are not visible.
The code in this event handler must be structured in a way that only the data sources related to the displayed view are processed:
if ((PAGEBOOK_1.getSelectedPageIndex() == 0)) {
// Touch data sources relevant for your first page
// ...
} else if ((PAGEBOOK_1.getSelectedPageIndex() == 1)) {
// Touch data sources relevant for your second page
// ...
} else if ((PAGEBOOK_1.getSelectedPageIndex() == 2)) {
// Touch data sources relevant for your third page
// ...
}
2. Carefully select the data sources that are loaded at startup
–> Performance improvement potential : very high
By default, all data sources are loaded in Design Studio at start up. For simple dashboards, this does not alter the perception of the end user and the data show up in a few seconds – with the advantage that they are now included.
For multi-page applications, the number of data sources and of components to be loaded will have a more significant impact and the end user may need to wait for an approximate 30s to 1 minute if nothing is settled to change this.
Solution: since only the data sources for the first screen are needed at startup, all other data sources should set the “Load In Script” to “true”.
 These other data sources must be loaded afterward within the script making the related components visible:
DS_1.loadDataSource();
Note: when a startup script is used (for example in the case of multiple views, to handle the fact only one view is visible), not only “Load in Script” must be properly set as described above, but also you need to pay attention for the “loadDataSource()” in the script to avoid to load Datasources unnecessarily with a performance impact. To make it simpler:
| Load in script | loadDatasource | Consequence on processing | Consequence on Performance |
| False | Not called | KPI is visible – the datasource is loaded | Positive impact - Expected setting for visible KPIs on startup – |
| False | Called | Second loaddatasource() is ignored | No impact |
| True | Called | KPI is not visible on startup – however you load the Datasource | Positive impact - Expected setting for KPIs not visible on startup – performance depends on the datasource, and will impact the time to switch to the KPI |
| True | Not called | Error: you try to display a KPI while the datasource is not loaded | Negative impact |
3. Initialize data sources in “background processing” (available since 1.2)
–> Performance improvement potential : very high
This feature can help if:
- Multiple data sources per screen are really needed
- The components relying on these data sources are visible at the same time.
With “background processing”, the “most important” data sources can be initialized first (and these components show the data right away) and the other components are initialized shortly after in the “On Background Processing” script of the application.
Example:
Supposing when you open your dashboard, you have several datasources/charts to show in the first page, and other datasources/charts in other pages.
What the background processing will allow you to do is:
- Show data, chart after chart for the first page (You have to define which chart you want to load/show first, then the second one, third one, …)
- As soon as all charts from page 1 are loaded, load charts for the other pages with the background processing mode. This will improve your opening time, and the load of datasources from page 2, 3, … will be transparent for end-users.
In Design Studio:
- For datasources/charts that you need first, keep “Load in script = false”
- For all other datasources, please select “Load In Script = true”. Then in the “On Startup” script this line must be added:
APPLICATION.doBackgroundProcessing();
This will trigger the “On Background Processing” script after the rendering has finished. Inside the “On Background Processing” script, the other data sources can be initialized with line calls like:
DS_XX.loadDataSource();
Note that this concept is not limited to two levels (“main” data sources vs. other data sources), but it is also easily possible to create a sequence-chain of data sources to be initialized.
Note: the “On Background Processing” concept is not limited to the application startup. On newly displayed pages of a pagebook or tabstrip the most important data can also be shown first and the other data sources can be initialized subsequently.
Taking an example:
To use a tile effect, in which datasources are loaded one-by-one, the application designer can use the recursive functionality.
If 6 different DSs are used within the application, and they show their data one after the other, a script like this one could be used:

On the “On Startup” script, please add
APPLICATION.doBackgroundProcessing();
Create a variable Variable1, initialize it to 0
Then, on the background processing function, add:
if(Variable1 == 0){
DS_1.loadDataSource();
//the chart linked to DS_1 will appear
}
if(Variable1 == 1){
DS_2.loadDataSource();
//the chart linked to DS_2 will appear
}
if(Variable1 == 2){
DS_3.loadDataSource();
//the chart linked to DS_3 will appear
}
if(Variable1 == 3){
DS_4.loadDataSource();
//the chart linked to DS_4 will appear
}
…
Variable1 = Variable1 +1;
if(Variable1 < 6){
APPLICATION.doBackgroundProcessing();
}
Following this code, tiles will appear one after the other one. During the time you will load DS_2, DS_3, etc… end-users will be able to read/play with DS_1, and the loading time of DS_2, DS_3, etc… will be transparent for end-users. So, the perception of the loading time will be completely different.
4. Upgrade to version 1.5 SP0
–> Performance improvement potential : very high
In this release, a number of changes have been introduced in the Designer and in the BIP Add-on. Please find more information here:
http://scn.sap.com/community/businessobjects-design-studio/blog/2015/04/15/design-studio-15--the-per...
5. SetVariableValue/setFilter/setDataSelection
–> Performance improvement potential : very high
Depending on the definition of the source BW Queries, you may have to create some filters in Design Studio especially in case end-users have required drop down lists, list boxes, etc…
To achieve this, there are various possibilities with different costs on the performance. In particular, it is preferable to use a “setFilter” instead of setVariableValue” wherever possible. “setVariableValue” impacts the VariableContainer and therefore refreshes all the datasources embedded in this container. This may significantly impact the performance, executing more data refresh than needed.
To summarize, here is a general impact of the different types of filters on the performance:
Highest: “setVariable”: BW roundtrips for multiple data sources
Medium: “setFilter”: BW roundtrip for one data source
Lowest: “setDataSelection”: no BW roundtrip
6. Use one datasource for multiple charts (available since 1.2)
–> Performance improvement potential : medium / high
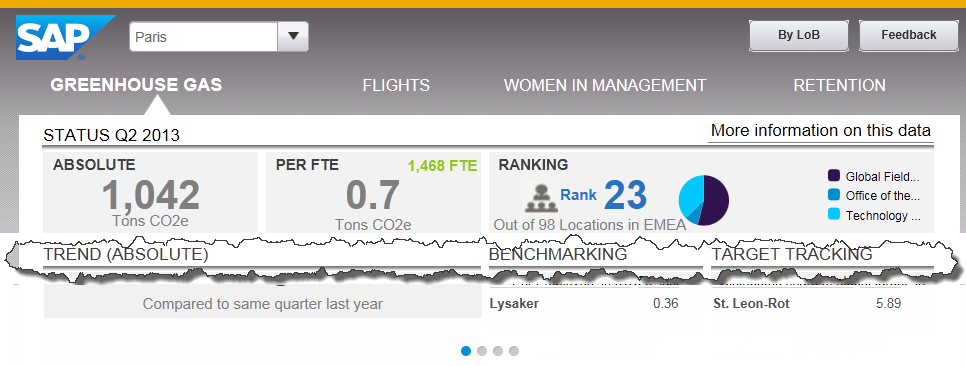
If several charts show the result set of the same query in different ways in your application, this requires any version until 1.1 to create distinct data sources for each chart. Each of the data sources used a different “Initial View” setting to display the different data.
Design Studio 1.2 offers the possibility to use a single data source in multiple charts. The data source has an Initial View that contains the superset of all needed data. The chart itself has a new property “Data Selection” which allows filtering only the relevant data for the specific chart.
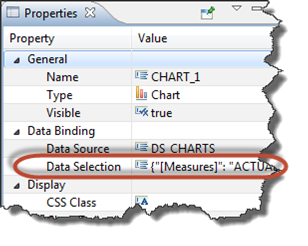
The “Data Selection” can be exposed via a “picking tool” in the property sheet or by editing the “Data Selection” manually. In most cases the picking tool should be enough. The syntax for manual data edition is not yet fully documented.
As data sources are the most significant performance driver in Design Studio applications, minimizing the number of data sources is always a significant performance gain.
7. Care of issues on the “Error log”
–> Performance improvement potential : small / medium
When the application is running, you should check carefully “Message View” or in the Designer’s “Error Log” view. Sometimes these entries indicate programming errors/issues. Some programming errors could impact performance.
For example, if the data source is asked for data that does not exist (warning message: There is a problem with the measure or dimension that you wanted to select using getData or getDataAsString), the tool will check for a non-existence, with high cost (generally via a backend-roundtrip).
8. Use “Global Script Variables” instead of “hidden text fields”
–> Performance improvement potential : small / medium
In the past, Global Script Variables were not available in Design Studio; therefore, you had to use “Hidden text fields” or Dropdown lists to simulate variables.
This has changed since version 1.1. Global variables are available and use far less resources than a hidden text field as it overall reduces the number of components. It also cleans up the “Outline View” of the application.
9. Use CSS classes in one text field instead of two text fields
–> Performance improvement potential : small / medium
On your app, if you need:
- to increase size when an item is selected
- to put a text when an item is selected
- show values in red or green depending of the value (for e.g. up or down to 0)
- …
You should leverage the dynamic javascript code (setCSSClass), instead of:
- overlapping two texts (one in bold and one without bold) and play with dynamic visibility
- overlapping two texts (one in red and one in green) and play with dynamic visibility
- …
Doing this, the number of text fields is reduced and performance improved. The reduced number of components will save resources and make the complex tree in the “Outline” view more usable.
Conclusion
Following all of these recommendations with a careful management of your javascript, your queries, and your components, you can expect to have a dashboard running very fast.
Design Studio offers a smart way of data management, processing the right minimum of sources (only information that your business can view). In parallel, the background processing helps to load the data for other KPIs, other views, in a transparent way for the end user. With this, data are already there when the user switches to another view and information comes up instantaneously.
Have a good time on Design Studio!!
- SAP Managed Tags:
- SAP BusinessObjects Design Studio
23 Comments
You must be a registered user to add a comment. If you've already registered, sign in. Otherwise, register and sign in.
Labels in this area
-
ABAP CDS Views - CDC (Change Data Capture)
2 -
AI
1 -
Analyze Workload Data
1 -
BTP
1 -
Business and IT Integration
2 -
Business application stu
1 -
Business Technology Platform
1 -
Business Trends
1,661 -
Business Trends
88 -
CAP
1 -
cf
1 -
Cloud Foundry
1 -
Confluent
1 -
Customer COE Basics and Fundamentals
1 -
Customer COE Latest and Greatest
3 -
Customer Data Browser app
1 -
Data Analysis Tool
1 -
data migration
1 -
data transfer
1 -
Datasphere
2 -
Event Information
1,400 -
Event Information
65 -
Expert
1 -
Expert Insights
178 -
Expert Insights
280 -
General
1 -
Google cloud
1 -
Google Next'24
1 -
Kafka
1 -
Life at SAP
784 -
Life at SAP
11 -
Migrate your Data App
1 -
MTA
1 -
Network Performance Analysis
1 -
NodeJS
1 -
PDF
1 -
POC
1 -
Product Updates
4,577 -
Product Updates
330 -
Replication Flow
1 -
RisewithSAP
1 -
SAP BTP
1 -
SAP BTP Cloud Foundry
1 -
SAP Cloud ALM
1 -
SAP Cloud Application Programming Model
1 -
SAP Datasphere
2 -
SAP S4HANA Cloud
1 -
SAP S4HANA Migration Cockpit
1 -
Technology Updates
6,886 -
Technology Updates
408 -
Workload Fluctuations
1
Related Content
- Unify your process and task mining insights: How SAP UEM by Knoa integrates with SAP Signavio in Technology Blogs by SAP
- SAP HANA Cloud Vector Engine: Quick FAQ Reference in Technology Blogs by SAP
- Empowering Retail Business with a Seamless Data Migration to SAP S/4HANA in Technology Blogs by Members
- 10+ ways to reshape your SAP landscape with SAP Business Technology Platform - Blog 7 in Technology Blogs by SAP
- 10+ ways to reshape your SAP landscape with SAP Business Technology Platform – Blog 4 in Technology Blogs by SAP
Top kudoed authors
| User | Count |
|---|---|
| 13 | |
| 11 | |
| 10 | |
| 9 | |
| 9 | |
| 7 | |
| 6 | |
| 5 | |
| 5 | |
| 5 |