Roll Your own Analysis Office Features (Part IV) -...
Technology Blogs by SAP
Learn how to extend and personalize SAP applications. Follow the SAP technology blog for insights into SAP BTP, ABAP, SAP Analytics Cloud, SAP HANA, and more.
Now that we've discussed the pros and cons of using VSTO versus VBA, let’s try our hand at creating a very simple app in VSTO. We have a query consisting of sales figures, where one of the available dimensions is the “sold-to party country”. We are presuming here, that we want a dashboard style app with a simplified interface and the Analysis ribbon might even be hidden entirely. Rather than using the usual Analysis filtering methodologies, we’ll create a new ribbon, allowing the user to filter by country simply by selecting the flag of the chosen country in the ribbon as shown in the video:
Since this tutorial is a bit long for a single blog post, we'll build the layout this time and next time we'll add the code to make it work.
To build this, we need the following:
A workbook with a suitable query.
32x32 pixel country flag icons for the country flags or something that suits your query (as long as it is 32x32). I grabbed mine from the installed clipart in MS Visio.
A copy of Visual Studio. I use 2010 in this exercise, though it works exactly the same if you use 2012.
We’ll add a ribbon with the flags in toggle buttons. In the on-click events of the buttons, we’ll do our filtering.
First, create a new workbook and add your data source. Then close it. Open Visual Studio and create a new Excel Workbook project. You can also create a template or general Excel plugin, but I’d recommend against it. We want to confine our app to a single workbook and don’t need an otherwise unnecessary plugin hanging around.
When prompted to create a new workbook, or to copy an existing workbook, select the latter and import the workbook that you just created.
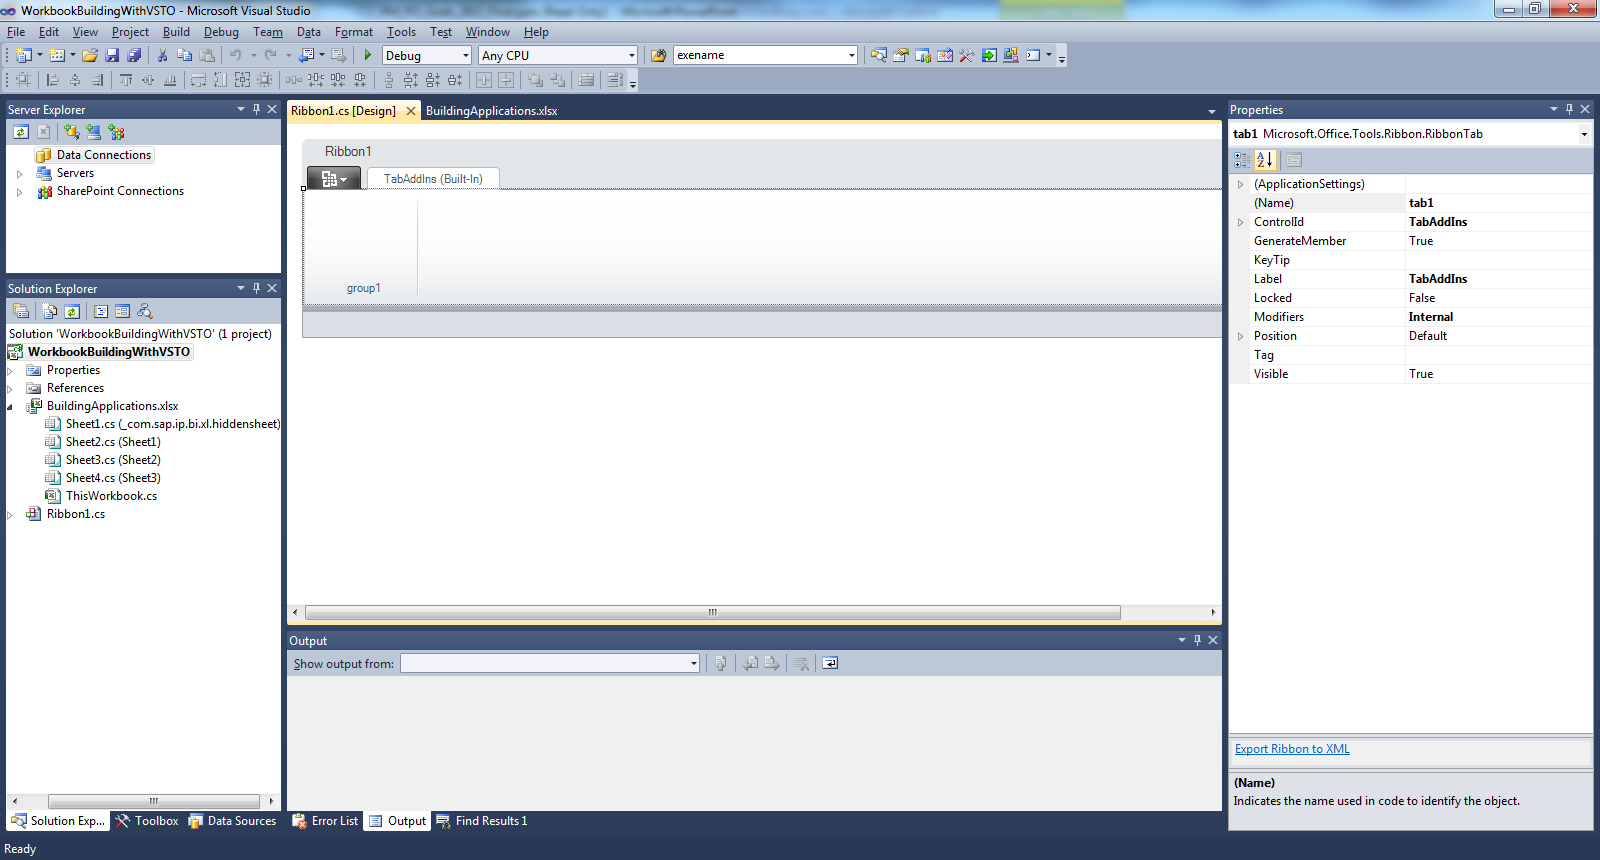
After your workbook project has been created, add a new ribbon to it. Go to the Solution Explorer pane. Right click on the project root, select “Add” from the context menu and select new Item. Select “Ribbon (Visual Designer)”.
Feel free to use the properties pane (shown on the left) to rename your ribbon and group.
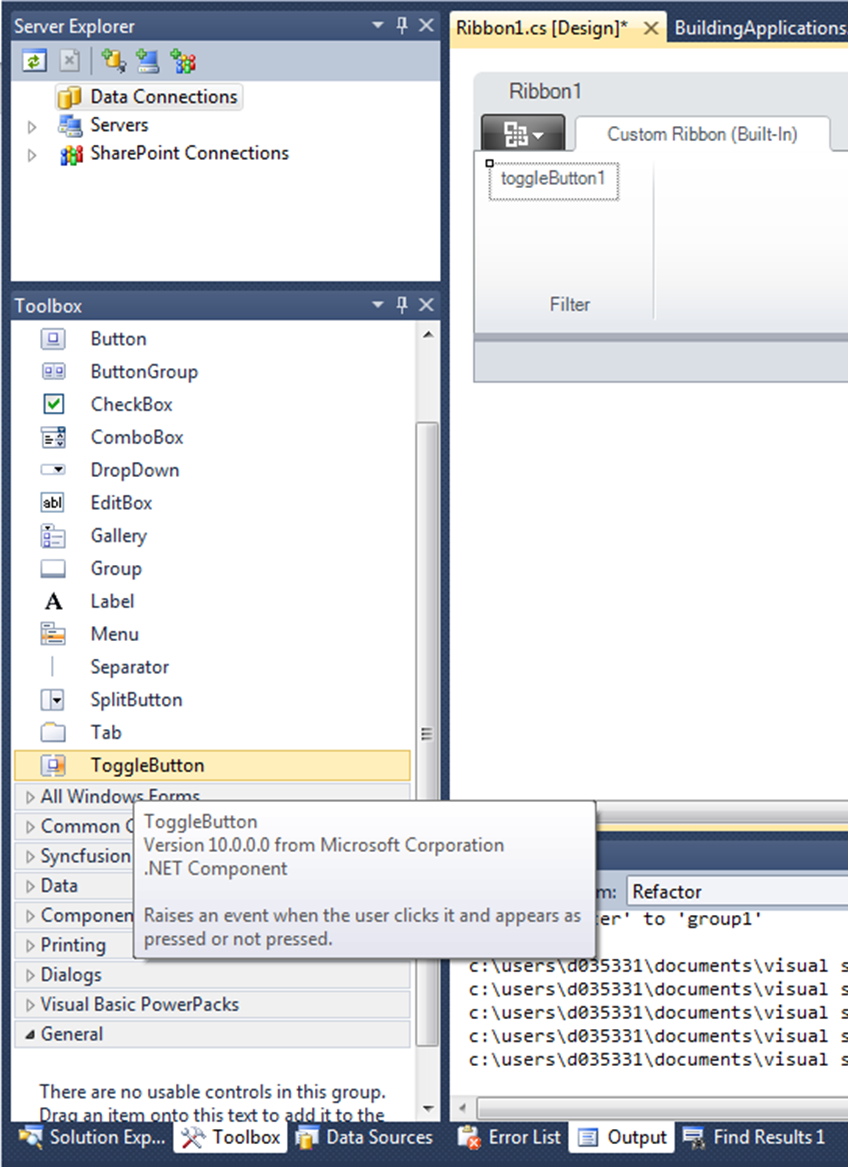
From the Toolbox tab, drag five ToggleButtons to your filter group in the custom ribbon. We’re using five, because our data source has five countries.
For each of the buttons, you should:
Set the control size from regular to large. (so that you have a big button, instead of a small one)
Set the label to display the country name. (or whatever the name is of the dimension member you are filtering for)
Set the super tip to inform that clicking on this button will filter on that country. (or whatever the name is of the dimension member you are filtering for)
Add the appropriate icon. (you can load this from an image file)
As a recommendation, the name of the button should be set to something which helps you remember which button is which, when working inside the C# code later on. E.g. instead of toggleButton1 to toggleButton5, you could use toggleButtonAU, etc.
When you are finished massaging the ribbon buttons’ properties, your ribbon should look like this in Visual Studio.
Now we have the graphical layout of our app. Next time, we’ll work on wiring up the events to make the buttons actually work.