
- SAP Community
- Products and Technology
- Technology
- Technology Blogs by SAP
- ** TEAM FPM ** - A new Chart UIBB
Technology Blogs by SAP
Learn how to extend and personalize SAP applications. Follow the SAP technology blog for insights into SAP BTP, ABAP, SAP Analytics Cloud, SAP HANA, and more.
Turn on suggestions
Auto-suggest helps you quickly narrow down your search results by suggesting possible matches as you type.
Showing results for
Advisor
Options
- Subscribe to RSS Feed
- Mark as New
- Mark as Read
- Bookmark
- Subscribe
- Printer Friendly Page
- Report Inappropriate Content
10-07-2013
3:02 PM
In my last blog I described how a Java Script chart library can be integrated on basis of a Freestyle UIBB approach by using the new HTML5 Island of Web Dynpro ABAP. This kind of procedure offers unlimited possibilities to ABAP developers who are familiar with JSON and Java Script, or at least have the time (hours and days) to invest into this topic. Nevertheless, what about developers who are more focused on the application development in the backend system? This often requires a full time investment and an affinity to ABAP - for very good reasons ...
During the "HTML5 Island Hype" times we stumbled over a very elegant and nice chart library, named CVOM (Common Visual Object Model) HTML5 Visualization Library. It belongs to the SAP portfolio and was already under investigation by SAPUI5. Soon there was an agreement on having a new FPM Chart UIBB with the complete infrastructure that FPM application developers like and appreciate, and in the meantime we can offer a quite good result to our customers with SAP Netweaver 740 SP4.
Before I go into further detail, just one basic remark on CVOM. This library is built on top of D3 (Data Driven Documents), it renders so-called vector-based graphics via SVG (Scalable Vector Graphics). As a result there is not loss of quality if a graphic is zoomed or resized. Web Dynpro ABAP has provided a corresponding Chart UI Element that renders CVOM charts. You will need a browser that is able to handle HTML5, which is not a problem at all if you take one of the most recent versions.
A Data Driven Approach
There are two different basic use cases to generate charts:
- Data driven approach
- Type driven approach
When following the data driven approach the application developer provides first the data on which a chart is going to be generated. At a later point in time (at the latest during runtime) a chart type is selected that fits to the data provided. In contrast, for the type driven approach the application developer decides first for a chart type and then prepares a data set that fits to the selected type.
The new FPM Chart UIBB (WD component FPM_CHART_UIBB) can be consumed via the data driven approach. This covers the first basic use case and it fits well into the FPM architecture, in which the Feeder Class (the data supplier) means a leading component.
The application developer is never forced to invest into techniques close to the rendering (JSON, Java Script). Instead he/she stays focused on the backend application logic and the corresponding data retrieval from arbitrary data sources (classic DDIC, In-Memory, Cloud, SOA, ODATA etc.), see Figure 1 below.
Basically the data driven approach allows for generating several chart types on one data set. For instance a data set that is being visualized via a Bar Chart can be also rendered as an Area or Line Chart. With restriction to one measure the same data set can be rendered as a Pie Chart or Donut Chart, and so forth.
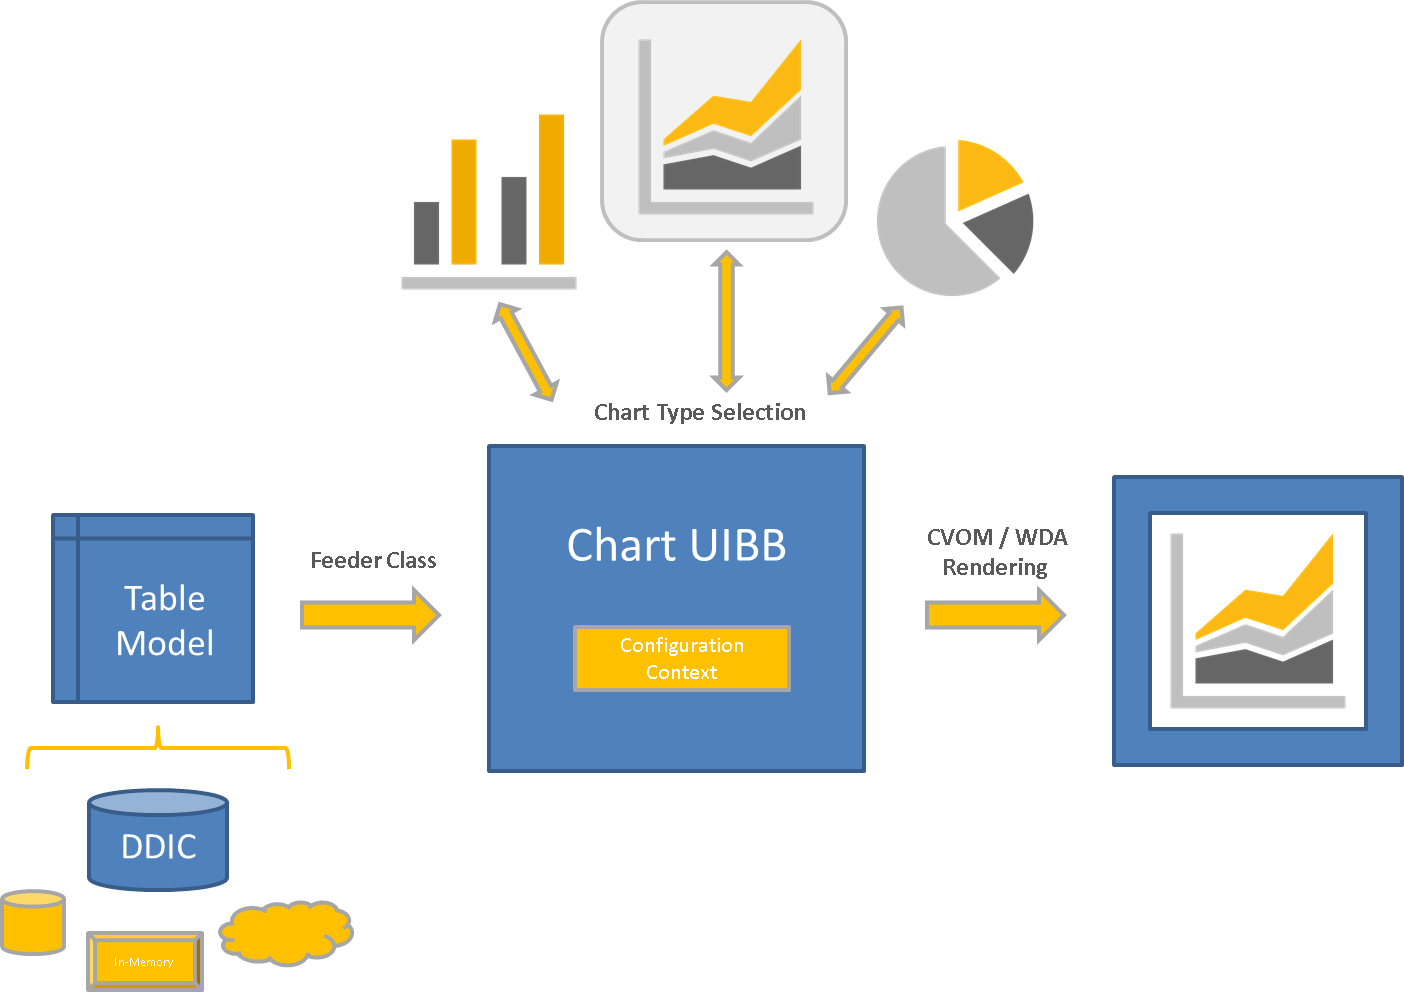
Figure 1: A data driven approach for the FPM Chart UIBB
The Table Model
Once you start to describe the term data, you will end soon in a discussion on data models. In a first version we offer a simple Table Model that can be addressed by e.g. DDIC table types and that can be efficiently consumed by the SAP Business Suite. We found the table model to be an excellent candidate that should be exposed by the FPM APIs, since it can be easily prepared from most of the DDIC table types. E.g. simply via
DATA: lt_table TYPE << DDIC_TABLE_TYPE >>,
lo_table_descr TYPE REF TO cl_abap_tabledescr.
lo_table_descr ?= cl_abap_tabledescr=>describe_by_data( lt_table ).
The Table Model is provided by the application developer in the Feeder Class (method GET_DEFINITION). Then on configuration level (dynamic or static) Dimensions and Measures are defined on basis of the given columns, i.e. the the single columns (resp. table fields) can be defined either as dimension or measure.
A Dimension is regarded in this context as a range (e.g. City, Country, Month, Year and Currency Code) whereas a Measure is understood as something that can be quantified via numbers only. A Measure can be always used as a Dimension; but a Dimension cannot be converted always in to a Measure.
| Country | Year | Product | Profit | Revenue |
|---|---|---|---|---|
| China | 2001 | Car | 25 | 66 |
| China | 2001 | Truck | 159 | 100 |
| USA | 2001 | Car | 58 | 12 |
| USA | 2001 | Truck | 149 | 34 |
| Canada | 2001 | Car | 58 | 35 |
| Canada | 2001 | Truck | 38 | 232 |
Table 1 Example for the FPM Table Model. Each column is defined either as Dimension or Measure
The Table Model can be accessed via Feeder Interface IF_FPM_GUIBB_CHART. There are three Table Model interfaces:
- IF_FPM_CHART_TABLE_MODEL
- IF_FPM_CHART_TABLE_DATA
- IF_FPM_CHART_TABLE_SELECTION
The first is being exposed via Model Factory interface IF_FPM_CHART_MODEL_FACTORY, method GET_TABLE_MODEL. The second is being exposed via Model Factory interface IF_FPM_CHART_DATA_FACTORY, method GET_TABLE_MODEL. The application developer can access these interfaces within Feeder methods GET_DEFINITION and GET_DATA.
In contrast, the third interface IF_FPM_CHART_TABLE_SELECTION is being exposed via event parameter FPM_CHART_SELECTION of FPM event FPM_CHART_SELECT, and is typically accessed in the Feeder methods PROCESS_EVENT and GET_DATA.
Via Interface IF_FPM_CHART_TABLE_DATA the application developer sets the current chart data set (method SET_DATA). Method GET_DIMENSIONS and GET_MEASURES may be used to enable (resp. optimize) the selection of data in the Feeder Class.
Configuration Environment
On configuration level, creating a new chart the application developer decides first for the Feeder Class. Then an assignment of Measures and Dimensions to the Chart UIBB Schema (see Figure 2) can be done. In a next step the application developer may choose a chart type (different from the default one). the set of available chart types is driven by the amount of Measures and Dimensions and their respective assignment to the axis index and sequence index. An overview can be found in the attached document.
If desired, further changes can be done with regard to size, title, legend, colors etc.by using the General Settings panel (see Figure 3). The General Settings are grouped into Basic Settings, Plot Area, X-Axis, and Y-Axis. The settings displayed for each are dependent on the chart type.
There are also settings (e.g. axis, legend or chart title) that can be changed later during the runtime in the Feeder Class, see the interface IF_FPM_CHART_SETTINGS in method GET_DATA of interface IF_FPM_GUIBB_CHART.
Besides the graphical rendering also a Chart Toolbar can be configured on basis of actions that are defined in the Feeder Class. This approach is well known in FPM, see e.g. the List and Tree UIBB.

Figure 2: Chart UIBB Design Time - Adding Measure and Dimensions to the Object Schema

Figure 3: Chart UIBB Design Time - Changing the chart settings
Personalization Dialog
By definition the data driven approach allows for rendering the data model via different chart types. It is obvious that the end user should also have the possibility to decide for a favorite chart type during the runtime, after the application developer has selected a default chart type during the design time.
The new FPM Chart UIBB provides a personalization dialog on which the end user can make some favorite settings with regard to the chart type, drawing finish, legend visibility etc. (see Figure 4). Before, the personalization dialog has to be enabled on configuration level (see Figure 3).

Figure 4: Chart UIBB Runtime - Personalization Dialog
Accessibility Mode
There is also a corresponding tabular rendering of the chart data with regard to the SAP product standard Accessibility (see Figure 5). The new FPM Chart UIBB will switch to the accessibility mode, if you provide e.g. the URL parameter sap-accessibility=X.

Figure 5: Chart UIBB Runtime - Accessibility Mode
Test and Demo Applications
There are a couple of test (resp. demo) applications that are delivered with SAP Netweaver 740 SP4. Please check out the following application configurations:
- FPM_TEST_CHART_PERS: Chart types, chart events and personlization dialog
- FPM_TEST_CHART: Different chart examples on basis of a dynamic Feeder Class
- FPM_TEST_CHART_SADL_SBOOK: Analyze table SBOOK by using the Service Adaptation Definition Language(SADL) on a HANA database
- WDR_TEST_CHART: Basic features of the Web Dynpro ABAP chart UI element
Additional Concepts
The new FPM Chart UIBB is already productively used by the current SAP Business Suite 7 Innovations 2013. In addition FPM has delivered some additional concepts on top of the new FPM Chart UIBB: You will be amazed :shock: what kind of cool stuff :!: is related to this! Maybe a couple of additional blogs will be supported via SCN in the near future.
- SAP Managed Tags:
- UI Floorplan Manager for Web Dynpro ABAP
44 Comments
You must be a registered user to add a comment. If you've already registered, sign in. Otherwise, register and sign in.
Labels in this area
-
ABAP CDS Views - CDC (Change Data Capture)
2 -
AI
1 -
Analyze Workload Data
1 -
BTP
1 -
Business and IT Integration
2 -
Business application stu
1 -
Business Technology Platform
1 -
Business Trends
1,658 -
Business Trends
92 -
CAP
1 -
cf
1 -
Cloud Foundry
1 -
Confluent
1 -
Customer COE Basics and Fundamentals
1 -
Customer COE Latest and Greatest
3 -
Customer Data Browser app
1 -
Data Analysis Tool
1 -
data migration
1 -
data transfer
1 -
Datasphere
2 -
Event Information
1,400 -
Event Information
66 -
Expert
1 -
Expert Insights
177 -
Expert Insights
295 -
General
1 -
Google cloud
1 -
Google Next'24
1 -
Kafka
1 -
Life at SAP
780 -
Life at SAP
13 -
Migrate your Data App
1 -
MTA
1 -
Network Performance Analysis
1 -
NodeJS
1 -
PDF
1 -
POC
1 -
Product Updates
4,577 -
Product Updates
341 -
Replication Flow
1 -
RisewithSAP
1 -
SAP BTP
1 -
SAP BTP Cloud Foundry
1 -
SAP Cloud ALM
1 -
SAP Cloud Application Programming Model
1 -
SAP Datasphere
2 -
SAP S4HANA Cloud
1 -
SAP S4HANA Migration Cockpit
1 -
Technology Updates
6,873 -
Technology Updates
419 -
Workload Fluctuations
1
Related Content
- What you need to know about Finance in SAP S/4HANA Cloud, Public Edition in Technology Blogs by SAP
- Product Updates for SAP Business Application Studio - March 2024 Edition in Technology Blogs by SAP
- Artificial Intelligence meets SAP Customer Engagement Initiative - Register until March 08, 2024! in Technology Blogs by SAP
- To our Partners – SAP Customer Engagement Initiative Projects open for registration until March 08 in Technology Blogs by SAP
- Cloud ALM for Team Task Management and Planning in Technology Blogs by Members
Top kudoed authors
| User | Count |
|---|---|
| 36 | |
| 25 | |
| 17 | |
| 13 | |
| 8 | |
| 7 | |
| 6 | |
| 6 | |
| 6 | |
| 6 |