
- SAP Community
- Products and Technology
- Technology
- Technology Blogs by Members
- IDM SQL Basics #2: Locating problem queries
Technology Blogs by Members
Explore a vibrant mix of technical expertise, industry insights, and tech buzz in member blogs covering SAP products, technology, and events. Get in the mix!
Turn on suggestions
Auto-suggest helps you quickly narrow down your search results by suggesting possible matches as you type.
Showing results for
Former Member
Options
- Subscribe to RSS Feed
- Mark as New
- Mark as Read
- Bookmark
- Subscribe
- Printer Friendly Page
- Report Inappropriate Content
10-04-2013
10:16 AM
Introduction
Entries marked TBD (To Be Done) will be expanded later.
Update 25.07.2014: As Matt outlines the situation in The Future of SAP IDM, IdM is moving to Sofia, and our Labs team are moving on to other ventures. It is very unlikely that I will update these blog entries any further. If someone else here in SDN wants to take over and/or use parts of this in improved blog entries you are most welcome to do so. More might be available in raw at Queries and useful(?) stuff, infodump
This is part 2 of the "IdM SQL Basics" blog posts.
#1: Overview of IDStore views, tables, queries & basic examples and some examples of performance impacts => Here
#2: How to locate problem queries in your implementation => You're here!
#3: Testing and improving queries SQL Server, Oracle, DB2 => Here
For the purpose of this document a problem query is one that takes a long time to complete, not one that doesnt work. And depending on where the query is used a long time can be measured in milliseconds, seconds, or minutes. There are a couple of built in tools to help you locate problems and problem queries that take an excessive amount to finish and causes bottlenecks as well as queries and tools that we (or I) use during development and support sessions. I'll also try to address which problem situations each method can be used to troubleshoot.
The tools I'll try to cover are
- Built in execution threshold logging
- Database queries
- Database tools (Activity Monitor, SQL Profiler, Enterprise Manager, Solution Manager)
- JMX Developer Trace
1. Finding problems using execution threshold logging
I'm starting with this most underused gem, the Execution Threshold Log. This apparently little known feature is built into the IdM product and logs executions of queries or procedures that exceed a specified amount of time. The specified amount of time is set using the global constant MX_LOG_EXEC_THRESHOLD or in the admin UI. This constant should already exist on your 7.2 system and have a fairly large number assigned to it, but if its not there you can create it manually. An important thing to keep in mind is that the number entered here is milliseconds. So entering 1 will cause large amounts of useless logs to be generated.
Events logged by this function are logged to the MC_EXEC_STAT table, but you should use the IDMV_EXEC_STAT view to look at the content as it gives some columns text-values that improve readability. You can also see the content of this in the admin UI.The function will log most operations done by the DSE RunTime, Dispatcher, UI and most of the database procedures they use. This means that slow uSelect operations, access controls, dispatcher job allocation and a host of other problems can be found by this function.
IDMV_EXEC_STAT
This view will contain a row of information for each event that exceeded the set limit. It contains a lot of useful information and columns that you can look at. What I usually do is run:
select datetime,componentname,mcExecTime,jobname,taskname,mskeyvalue,mcStatement from idmv_exec_stat order by mcExecTime desc
This gives the most useful columns with the worst offenders listed first, like this example that I made:
There are more columns in the view so please check it out. Here's a brief overview of the columns listed in my example:
- MCEXECTIME - how many milliseconds the operation took to perform
- COMPONENTNAME - where the threshold was exceeded (procedure, dispatcher, runtime ...)
- JOBNAME/TASKNAME - If available they contain the name of the job or task
- MSKEYVALUE - the user that the task was running for if available (not in jobs for instance)
- MCSTATEMENT - Content depends on what type of event is logged. Can be a procedure name w. parameters, a query from conditional or switch tasks or something quite different
In any case, my simple example shows that I have a switch task statement that takes 6 to 12.5 seconds to execute. This task processes less than 5 entries a minute in worst case and would be a bottleneck in any scenario. You can also see some additional messages about procedures taking time, but since I know that mcProcUserReconcile is a housekeeping task and that it processed 1000 entries in the reported time so I wont spend time on them. Unfortunately there are not any built in "this is normal" tags but you can ask here or through support if something looks out of whack with any product procedures. Once you know the name of the task, job or attribute that's causing you problems it should be fairly simple to locate it and try to fix the problem (see the other parts of this blog series).
The Admin UI allows configuration of the threshold and contains a logviewer that shows the table contents in the "Statement Execution" tab:

As summary the execution threshold log can and should be used during development and in mass-update/load tests in the QA environments to find problem areas early. Just keep in mind that this table is not emptied automatically (yet) so if you start using it please maintain it too. When the test is done and increase the threshold value to avoid unecessary logging while in production mode.
2. Finding problems using database queries
This section covers items that can also be found using database tools which is covered in the next section. If you've had an IdM support ticket open regarding performance and ended up talking with the team in Norway you might already know that we often dive into SQL Developer/SQL Server Management Studio and start running queries to get to the issue quickly. The queries we run depend highly on the problem we're trying to solve, but I'll try to give some usecases for them.
The biggest downside to these is that usually require more access than what the OPER account has so you'll have to find the system/sa password or ask a DBA to run them for you. In a development or QA environment I believe you should have access to this as well as DB tools to analyze performance during and after performance tests anyway.
These queries are useful when you have a hang-situation and suspect queries are blocked at the database level.
SQL Server
To list queries that are currently being executed on SQL Server you can use the following query:
SELECT database_id,st.text, r.session_id, r.status, r.command, r.cpu_time,r.total_elapsed_time

FROM sys.dm_exec_requests r CROSS APPLY sys.dm_exec_sql_text(sql_handle) AS st order by database_id
The SQL Server Activity Monitor will show the last completed query which will not help if you're wondering why nothing is happening at the moment.
To get the name for a database_id or ID of a database name in SQL Server use:
SELECT DB_ID ('MXMC_db')  -- This is case sensitive if the DB is installed with CP850_BIN2 collation

SELECT DB_NAME(10)  -- 10 being the database ID you want the name of...
To produce a listing of historical queries that have taken more than 1000ms to execute on average you can run the following:
SELECT

          last_execution_time,total_physical_reads,total_logical_reads,total_logical_writes, execution_count,total_worker_time,total_elapsed_time,

          total_elapsed_time / execution_count avg_elapsed_time,SUBSTRING(st.text, (qs.statement_start_offset/2) + 1,((CASE statement_end_offset

    WHEN -1 THEN DATALENGTH(st.text) ELSE qs.statement_end_offset END - qs.statement_start_offset)/2) + 1) AS statement_text

FROM sys.dm_exec_query_stats AS qs

CROSS APPLY sys.dm_exec_sql_text(qs.sql_handle) st

WHERE  total_elapsed_time / execution_count > 1000

      -- and execution_count > 10

ORDER BY total_elapsed_time / execution_count DESC;
The substring function picks out the "problem" code of procedures, and by uncommenting the line "and execution_count > X" you can also filter out statements run very seldom. Likewise you can also find often executed queries that are problematic by setting execution_count very high while lowering the total_elapsed_time/execution_count requirement. Also see Lamberts version of this statement in the comments section.
This can be very helpful to run after a performance test has completed. Before the test you can clear the statistics by running DBCC FREEPROCCACHE if youwant to clear out potentially stale data, but make sure to have a warmup time to repopulate caches in the test.
Oracle
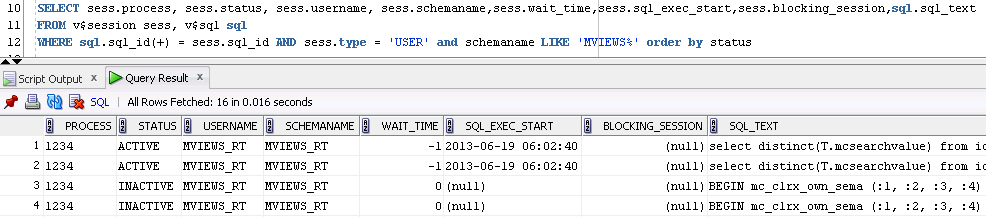
To list current active/inactive sessions for a schema, in my case my prefix is MVIEWS so the screenshot does not match 100% of the text, run:
SELECT sess.process, sess.status, sess.username, sess.schemaname,sess.wait_time,sess.sql_exec_start,sess.blocking_session,sql.sql_text

FROM v$session sess, v$sql sql

WHERE sql.sql_id(+) = sess.sql_id AND sess.type = 'USER' and schemaname LIKE 'MXMC%' order by status
This will give a list of sessions for the schema and show what query they're currently struggling with if any. This shows my problematic switch task in action:
If you only want to list active sessions and get the full SQL Text and SQL Ids you can try this variation of the query against the same two views as before:
select sess.USERNAME, sess.sid, sqlt.sql_id, sqlt.sql_text from v$sqltext_with_newlines sqlt, V$SESSION sess

where sqlt.address = sess.sql_address and sqlt.hash_value = sess.sql_hash_value and sess.status = 'ACTIVE'

and sess.username like 'MXMC%' order by sess.sid,sqlt.piece

To find queries that on average are slow running you can use a number of different queries. I've settled on variations of this:
SELECT  cast(ROUND(A.ELAPSED_TIME / A.EXECUTIONS / 1000000) as number(10)) SQL_AVG,

        cast(A.SQL_ID as varchar(20)) SQL_ID, cast(A.SQL_FULLTEXT as varchar(300)) SQL_TEXT,

        cast(A.EXECUTIONS as number(10)) EXECCOUNT, cast(NVL(S.PROGRAM,A.MODULE) as varchar(20)) PNAME,

        cast(NVL(S.USERNAME,A.PARSING_SCHEMA_NAME) as varchar(20)) USERID

  FROM  V$SQLAREA A, V$SESSION S

  WHERE A.SQL_ID = S.SQL_ID(+)

    AND cast(NVL(S.USERNAME,A.PARSING_SCHEMA_NAME) as varchar(20)) like 'MXMC%'  -- UserId / schemaname, adapt if required

    AND A.EXECUTIONS > 0  -- Can also be useful to set this value higher to find those executed often and running slow

    AND ROUND(A.ELAPSED_TIME / A.EXECUTIONS / 1000000) > 10 -- Executiontime > 10seconds increase/decrease as needed
This query lists sessions that are blocking other sessions
SELECT t.status, t.start_time,sess.username,sess.sid,sess.machine,sess.process,sess.blocking_session,sess.status, sess.username, sess.schemaname,sess.wait_time,sess.sql_exec_start,sql.sql_text

FROM v$session sess, v$sql sql , V$TRANSACTION t WHERE sql.sql_id(+) = sess.sql_id and t.ses_addr = sess.saddr and sess.sid in

(SELECT sess.blocking_session FROM v$session sess WHERE sess.blocking_session is not null and sess.type = 'USER' and schemaname LIKE 'MXMC%')
There's a lot of columns on V$SQLAREA og V$SESSION for the curious. This tries to list those queries that on average has used more than 10 seconds per execution.
With the SQL ID you can do fun stuff like getting the exexution plan like this (if you have DBMS_SQLTUNE available):
select DBMS_SQLTUNE.REPORT_SQL_MONITOR(type=>'HTML',report_level=>'ALL',sql_id=>'1zf0h9sw688bx') as report FROM dual;If you put the result of the query in a file named .html and you have a nicely formatted executionplan:

Exactly what to read from this we will try to get back to in part 3.
DB2
TBD See introduction section
3. Database tools
Both SQL Server and Oracle provide monitoring tools that can help troubleshoot a hang situation. In your development and QA environment it can be very beneficial to have access to these if you need to fine-tune or troubleshoot your implementation. They usually provide reports of queries that are running slow, most frequently and having the highest costs. This is by no means a full guide to using these tools, but rather a quick introduction.
One common issue that I've experienced with all these tools is that they do not always show the current queries being executed, but rather show the lastcompleted query. This is often not very helpful and one of the reasons the queries listed in section 2 are preferable at times.
SQL Server Reports
The SQL Server has built in reports that extract much of the information found by the queries mentioned above. If you right click on the database instance and select Reports you'll find a good list to choose from. The "Object Execution Statistics" for example will give you a huge list of the executable object the server has processed for the instance. It can also be exported to Excel.
(Click to open in full size)

SQL Server Activity Monitor
The SQL Server Activity Monitor went through some drastic changes after the 2005 version, and I dont find it that helpful anymore. It will still list running sessions and allow you to see sessions/queries that are blocked or blocking each other.

I've constructed a scenario where the dispatchers are blocked by another transaction. When using the activity monitor you can sort using the Blocked By and Head Blocker to see what is currently (not) happening. First sorted by Blocked By:

And the Head Blocker:

At this time you can already start to look at the data available to get some understanding of the situation. The blocking session (75) is using the Global\I045111 login. This is not a login used by IdM but a domain login. If it was <prefix>_admin we'd know its the Management Console, the <prefix>_rt means it's either from the runtime engines or the dispatcher, and <prefix>_prov means it's the UI.
Its also possible that you encounter nested sessions, where session 75 is blocked by another session, and that itself is blocked by another etc. Sorting on the Head Blocker column will usually take you directly to the one causing the blockage.
You can right click on the sessions and see what the last SQL was, or you can use the query listed earlier. In this is the result when looking at session 75:

Replicating realistic scenarios is difficult, so I just made a transaction without bothering to commit it. Which happens very often if you use a DB client that does not autocommit transactions for you (SQL Developer and others on Oracle).
While you're in the Activity Monitor you should also note the Recent Expensive Queries tab which can be very useful during testing:

SQL Server Profiler
This application allows you to do full traces of the procedures and calls to the SQL Server. This can become huge amounts of data and it will affect performance . Also it requires a lot of privileges on the server (look it up if you need to, I just use SA).
TBD See introduction section
SQL Server Deadlock Trace
This is a very useful option if you're struggling with deadlock errors. It does not affect performance, and when a deadlock occurs the server will log involved processes and the execution stack which makes it somewhat easier (there's seldom anything easy in regards to deadlocks) to get to the source of the problem.
As SA run:
DBCC TRACEON (1222, -1)
This will create .trc files in your SQL Server log directory (C:\Program Files\Microsoft SQL Server\MSSQL10.MSSQLSERVER\MSSQL\LOG) when deadlocks occur.
To turn it off again, run
DBCC TRACEOFF (1222, -1)
It will also be disabled again when the SQL Server is restarted. The result is something like this example shows, where I've tried to illustrate where the two processes each own a lock thats blocking the other process, with a third involved just to confuse the picture. The clue lies in the "Waiter" and "Owner" ids:

More information can be found here: Deadlock trace (MS)
Oracle Enterprice Manager
TBD See introduction section
4. JMX Developer trace
The JMX Developer trace can be very helpful when troubleshooting performance problems from the WebUI/Rest interface. It logs the queries that are executed and their execution times.
http://service.sap.com/sap/support/notes/1907843
TBD See introduction section
Disclaimers, excuses & comments
This was part two in a series of posts that are focused on database queries, troubleshooting and curiosities related to the SAP Identity Management Identity Stores and its contents. It is focused on tables and views as they are in the 7.2 release, but some tips apply to 7.1 implementations as well. Do note that this is not an official guide and that official docs such as helpfiles, tickets, notes etc. are the no.1 source. I'm writing this based on experiences from support calls, implementations and from working in the IdM development team. Some of this is also available in the training for IdM 7.2 and other places. I'm not a DBA so if I'm doing something very backwards or completely wrong here, please let me know so I can improve the document.
Feel free to correct me, ask for additional examples and clarifications as I hope to keep this series updated with new information as it appears.
- SAP Managed Tags:
- SAP Identity Management
6 Comments
You must be a registered user to add a comment. If you've already registered, sign in. Otherwise, register and sign in.
Labels in this area
-
"automatische backups"
1 -
"regelmäßige sicherung"
1 -
"TypeScript" "Development" "FeedBack"
1 -
505 Technology Updates 53
1 -
ABAP
14 -
ABAP API
1 -
ABAP CDS Views
2 -
ABAP CDS Views - BW Extraction
1 -
ABAP CDS Views - CDC (Change Data Capture)
1 -
ABAP class
2 -
ABAP Cloud
2 -
ABAP Development
5 -
ABAP in Eclipse
1 -
ABAP Platform Trial
1 -
ABAP Programming
2 -
abap technical
1 -
absl
1 -
access data from SAP Datasphere directly from Snowflake
1 -
Access data from SAP datasphere to Qliksense
1 -
Accrual
1 -
action
1 -
adapter modules
1 -
Addon
1 -
Adobe Document Services
1 -
ADS
1 -
ADS Config
1 -
ADS with ABAP
1 -
ADS with Java
1 -
ADT
2 -
Advance Shipping and Receiving
1 -
Advanced Event Mesh
3 -
AEM
1 -
AI
7 -
AI Launchpad
1 -
AI Projects
1 -
AIML
9 -
Alert in Sap analytical cloud
1 -
Amazon S3
1 -
Analytical Dataset
1 -
Analytical Model
1 -
Analytics
1 -
Analyze Workload Data
1 -
annotations
1 -
API
1 -
API and Integration
3 -
API Call
2 -
Application Architecture
1 -
Application Development
5 -
Application Development for SAP HANA Cloud
3 -
Applications and Business Processes (AP)
1 -
Artificial Intelligence
1 -
Artificial Intelligence (AI)
4 -
Artificial Intelligence (AI) 1 Business Trends 363 Business Trends 8 Digital Transformation with Cloud ERP (DT) 1 Event Information 462 Event Information 15 Expert Insights 114 Expert Insights 76 Life at SAP 418 Life at SAP 1 Product Updates 4
1 -
Artificial Intelligence (AI) blockchain Data & Analytics
1 -
Artificial Intelligence (AI) blockchain Data & Analytics Intelligent Enterprise
1 -
Artificial Intelligence (AI) blockchain Data & Analytics Intelligent Enterprise Oil Gas IoT Exploration Production
1 -
Artificial Intelligence (AI) blockchain Data & Analytics Intelligent Enterprise sustainability responsibility esg social compliance cybersecurity risk
1 -
ASE
1 -
ASR
2 -
ASUG
1 -
Attachments
1 -
Authorisations
1 -
Automating Processes
1 -
Automation
1 -
aws
2 -
Azure
1 -
Azure AI Studio
1 -
B2B Integration
1 -
Backorder Processing
1 -
Backup
1 -
Backup and Recovery
1 -
Backup schedule
1 -
BADI_MATERIAL_CHECK error message
1 -
Bank
1 -
BAS
1 -
basis
2 -
Basis Monitoring & Tcodes with Key notes
2 -
Batch Management
1 -
BDC
1 -
Best Practice
1 -
bitcoin
1 -
Blockchain
3 -
BOP in aATP
1 -
BOP Segments
1 -
BOP Strategies
1 -
BOP Variant
1 -
BPC
1 -
BPC LIVE
1 -
BTP
11 -
BTP Destination
2 -
Business AI
1 -
Business and IT Integration
1 -
Business application stu
1 -
Business Application Studio
1 -
Business Architecture
1 -
Business Communication Services
1 -
Business Continuity
1 -
Business Data Fabric
3 -
Business Partner
12 -
Business Partner Master Data
10 -
Business Technology Platform
2 -
Business Trends
1 -
CA
1 -
calculation view
1 -
CAP
3 -
Capgemini
1 -
CAPM
1 -
Catalyst for Efficiency: Revolutionizing SAP Integration Suite with Artificial Intelligence (AI) and
1 -
CCMS
2 -
CDQ
12 -
CDS
2 -
Cental Finance
1 -
Certificates
1 -
CFL
1 -
Change Management
1 -
chatbot
1 -
chatgpt
3 -
CL_SALV_TABLE
2 -
Class Runner
1 -
Classrunner
1 -
Cloud ALM Monitoring
1 -
Cloud ALM Operations
1 -
cloud connector
1 -
Cloud Extensibility
1 -
Cloud Foundry
4 -
Cloud Integration
6 -
Cloud Platform Integration
2 -
cloudalm
1 -
communication
1 -
Compensation Information Management
1 -
Compensation Management
1 -
Compliance
1 -
Compound Employee API
1 -
Configuration
1 -
Connectors
1 -
Consolidation Extension for SAP Analytics Cloud
1 -
Controller-Service-Repository pattern
1 -
Conversion
1 -
Cosine similarity
1 -
cryptocurrency
1 -
CSI
1 -
ctms
1 -
Custom chatbot
3 -
Custom Destination Service
1 -
custom fields
1 -
Customer Experience
1 -
Customer Journey
1 -
Customizing
1 -
cyber security
2 -
Data
1 -
Data & Analytics
1 -
Data Aging
1 -
Data Analytics
2 -
Data and Analytics (DA)
1 -
Data Archiving
1 -
Data Back-up
1 -
Data Governance
5 -
Data Integration
2 -
Data Quality
12 -
Data Quality Management
12 -
Data Synchronization
1 -
data transfer
1 -
Data Unleashed
1 -
Data Value
8 -
database tables
1 -
Datasphere
2 -
datenbanksicherung
1 -
dba cockpit
1 -
dbacockpit
1 -
Debugging
2 -
Delimiting Pay Components
1 -
Delta Integrations
1 -
Destination
3 -
Destination Service
1 -
Developer extensibility
1 -
Developing with SAP Integration Suite
1 -
Devops
1 -
digital transformation
1 -
Documentation
1 -
Dot Product
1 -
DQM
1 -
dump database
1 -
dump transaction
1 -
e-Invoice
1 -
E4H Conversion
1 -
Eclipse ADT ABAP Development Tools
2 -
edoc
1 -
edocument
1 -
ELA
1 -
Embedded Consolidation
1 -
Embedding
1 -
Embeddings
1 -
Employee Central
1 -
Employee Central Payroll
1 -
Employee Central Time Off
1 -
Employee Information
1 -
Employee Rehires
1 -
Enable Now
1 -
Enable now manager
1 -
endpoint
1 -
Enhancement Request
1 -
Enterprise Architecture
1 -
ETL Business Analytics with SAP Signavio
1 -
Euclidean distance
1 -
Event Dates
1 -
Event Driven Architecture
1 -
Event Mesh
2 -
Event Reason
1 -
EventBasedIntegration
1 -
EWM
1 -
EWM Outbound configuration
1 -
EWM-TM-Integration
1 -
Existing Event Changes
1 -
Expand
1 -
Expert
2 -
Expert Insights
1 -
Fiori
14 -
Fiori Elements
2 -
Fiori SAPUI5
12 -
Flask
1 -
Full Stack
8 -
Funds Management
1 -
General
1 -
Generative AI
1 -
Getting Started
1 -
GitHub
8 -
Grants Management
1 -
groovy
1 -
GTP
1 -
HANA
5 -
HANA Cloud
2 -
Hana Cloud Database Integration
2 -
HANA DB
1 -
HANA XS Advanced
1 -
Historical Events
1 -
home labs
1 -
HowTo
1 -
HR Data Management
1 -
html5
8 -
HTML5 Application
1 -
Identity cards validation
1 -
idm
1 -
Implementation
1 -
input parameter
1 -
instant payments
1 -
Integration
3 -
Integration Advisor
1 -
Integration Architecture
1 -
Integration Center
1 -
Integration Suite
1 -
intelligent enterprise
1 -
Java
1 -
job
1 -
Job Information Changes
1 -
Job-Related Events
1 -
Job_Event_Information
1 -
joule
4 -
Journal Entries
1 -
Just Ask
1 -
Kerberos for ABAP
8 -
Kerberos for JAVA
8 -
Launch Wizard
1 -
Learning Content
2 -
Life at SAP
1 -
lightning
1 -
Linear Regression SAP HANA Cloud
1 -
local tax regulations
1 -
LP
1 -
Machine Learning
2 -
Marketing
1 -
Master Data
3 -
Master Data Management
14 -
Maxdb
2 -
MDG
1 -
MDGM
1 -
MDM
1 -
Message box.
1 -
Messages on RF Device
1 -
Microservices Architecture
1 -
Microsoft Universal Print
1 -
Middleware Solutions
1 -
Migration
5 -
ML Model Development
1 -
Modeling in SAP HANA Cloud
8 -
Monitoring
3 -
MTA
1 -
Multi-Record Scenarios
1 -
Multiple Event Triggers
1 -
Neo
1 -
New Event Creation
1 -
New Feature
1 -
Newcomer
1 -
NodeJS
2 -
ODATA
2 -
OData APIs
1 -
odatav2
1 -
ODATAV4
1 -
ODBC
1 -
ODBC Connection
1 -
Onpremise
1 -
open source
2 -
OpenAI API
1 -
Oracle
1 -
PaPM
1 -
PaPM Dynamic Data Copy through Writer function
1 -
PaPM Remote Call
1 -
PAS-C01
1 -
Pay Component Management
1 -
PGP
1 -
Pickle
1 -
PLANNING ARCHITECTURE
1 -
Popup in Sap analytical cloud
1 -
PostgrSQL
1 -
POSTMAN
1 -
Process Automation
2 -
Product Updates
4 -
PSM
1 -
Public Cloud
1 -
Python
4 -
Qlik
1 -
Qualtrics
1 -
RAP
3 -
RAP BO
2 -
Record Deletion
1 -
Recovery
1 -
recurring payments
1 -
redeply
1 -
Release
1 -
Remote Consumption Model
1 -
Replication Flows
1 -
Research
1 -
Resilience
1 -
REST
1 -
REST API
1 -
Retagging Required
1 -
Risk
1 -
Rolling Kernel Switch
1 -
route
1 -
rules
1 -
S4 HANA
1 -
S4 HANA Cloud
1 -
S4 HANA On-Premise
1 -
S4HANA
3 -
S4HANA_OP_2023
2 -
SAC
10 -
SAC PLANNING
9 -
SAP
4 -
SAP ABAP
1 -
SAP Advanced Event Mesh
1 -
SAP AI Core
8 -
SAP AI Launchpad
8 -
SAP Analytic Cloud Compass
1 -
Sap Analytical Cloud
1 -
SAP Analytics Cloud
4 -
SAP Analytics Cloud for Consolidation
2 -
SAP Analytics Cloud Story
1 -
SAP analytics clouds
1 -
SAP BAS
1 -
SAP Basis
6 -
SAP BODS
1 -
SAP BODS certification.
1 -
SAP BTP
20 -
SAP BTP Build Work Zone
2 -
SAP BTP Cloud Foundry
5 -
SAP BTP Costing
1 -
SAP BTP CTMS
1 -
SAP BTP Innovation
1 -
SAP BTP Migration Tool
1 -
SAP BTP SDK IOS
1 -
SAP Build
11 -
SAP Build App
1 -
SAP Build apps
1 -
SAP Build CodeJam
1 -
SAP Build Process Automation
3 -
SAP Build work zone
10 -
SAP Business Objects Platform
1 -
SAP Business Technology
2 -
SAP Business Technology Platform (XP)
1 -
sap bw
1 -
SAP CAP
2 -
SAP CDC
1 -
SAP CDP
1 -
SAP CDS VIEW
1 -
SAP Certification
1 -
SAP Cloud ALM
4 -
SAP Cloud Application Programming Model
1 -
SAP Cloud Integration for Data Services
1 -
SAP cloud platform
8 -
SAP Companion
1 -
SAP CPI
3 -
SAP CPI (Cloud Platform Integration)
2 -
SAP CPI Discover tab
1 -
sap credential store
1 -
SAP Customer Data Cloud
1 -
SAP Customer Data Platform
1 -
SAP Data Intelligence
1 -
SAP Data Migration in Retail Industry
1 -
SAP Data Services
1 -
SAP DATABASE
1 -
SAP Dataspher to Non SAP BI tools
1 -
SAP Datasphere
9 -
SAP DRC
1 -
SAP EWM
1 -
SAP Fiori
2 -
SAP Fiori App Embedding
1 -
Sap Fiori Extension Project Using BAS
1 -
SAP GRC
1 -
SAP HANA
1 -
SAP HCM (Human Capital Management)
1 -
SAP HR Solutions
1 -
SAP IDM
1 -
SAP Integration Suite
9 -
SAP Integrations
4 -
SAP iRPA
2 -
SAP Learning Class
1 -
SAP Learning Hub
1 -
SAP Odata
2 -
SAP on Azure
1 -
SAP PartnerEdge
1 -
sap partners
1 -
SAP Password Reset
1 -
SAP PO Migration
1 -
SAP Prepackaged Content
1 -
SAP Process Automation
2 -
SAP Process Integration
2 -
SAP Process Orchestration
1 -
SAP S4HANA
2 -
SAP S4HANA Cloud
1 -
SAP S4HANA Cloud for Finance
1 -
SAP S4HANA Cloud private edition
1 -
SAP Sandbox
1 -
SAP STMS
1 -
SAP SuccessFactors
2 -
SAP SuccessFactors HXM Core
1 -
SAP Time
1 -
SAP TM
2 -
SAP Trading Partner Management
1 -
SAP UI5
1 -
SAP Upgrade
1 -
SAP Utilities
1 -
SAP-GUI
8 -
SAP_COM_0276
1 -
SAPBTP
1 -
SAPCPI
1 -
SAPEWM
1 -
sapmentors
1 -
saponaws
2 -
SAPS4HANA
1 -
SAPUI5
4 -
schedule
1 -
Secure Login Client Setup
8 -
security
9 -
Selenium Testing
1 -
SEN
1 -
SEN Manager
1 -
service
1 -
SET_CELL_TYPE
1 -
SET_CELL_TYPE_COLUMN
1 -
SFTP scenario
2 -
Simplex
1 -
Single Sign On
8 -
Singlesource
1 -
SKLearn
1 -
soap
1 -
Software Development
1 -
SOLMAN
1 -
solman 7.2
2 -
Solution Manager
3 -
sp_dumpdb
1 -
sp_dumptrans
1 -
SQL
1 -
sql script
1 -
SSL
8 -
SSO
8 -
Substring function
1 -
SuccessFactors
1 -
SuccessFactors Time Tracking
1 -
Sybase
1 -
system copy method
1 -
System owner
1 -
Table splitting
1 -
Tax Integration
1 -
Technical article
1 -
Technical articles
1 -
Technology Updates
1 -
Technology Updates
1 -
Technology_Updates
1 -
Threats
1 -
Time Collectors
1 -
Time Off
2 -
Tips and tricks
2 -
Tools
1 -
Trainings & Certifications
1 -
Transport in SAP BODS
1 -
Transport Management
1 -
TypeScript
2 -
unbind
1 -
Unified Customer Profile
1 -
UPB
1 -
Use of Parameters for Data Copy in PaPM
1 -
User Unlock
1 -
VA02
1 -
Validations
1 -
Vector Database
1 -
Vector Engine
1 -
Visual Studio Code
1 -
VSCode
1 -
Web SDK
1 -
work zone
1 -
workload
1 -
xsa
1 -
XSA Refresh
1
- « Previous
- Next »
Related Content
- Elevating Customer Engagement: Harnessing the Power of SAP Chatbots for a Personalized Experience in Technology Blogs by Members
- Empowering Vendors: The Transformative Impact of SAP Chatbot in Technology Blogs by Members
- Download File to XLSX in Technology Q&A
- SAP Datasphere - Space, Data Integration, and Data Modeling Best Practices in Technology Blogs by SAP
- Unable to run a query with secondary database in capm in Technology Q&A
Top kudoed authors
| User | Count |
|---|---|
| 11 | |
| 10 | |
| 7 | |
| 6 | |
| 4 | |
| 4 | |
| 3 | |
| 3 | |
| 3 | |
| 3 |