
- SAP Community
- Products and Technology
- Technology
- Technology Blogs by Members
- Data Geek Challenge - Immigration in Japan
Technology Blogs by Members
Explore a vibrant mix of technical expertise, industry insights, and tech buzz in member blogs covering SAP products, technology, and events. Get in the mix!
Turn on suggestions
Auto-suggest helps you quickly narrow down your search results by suggesting possible matches as you type.
Showing results for
Former Member
Options
- Subscribe to RSS Feed
- Mark as New
- Mark as Read
- Bookmark
- Subscribe
- Printer Friendly Page
- Report Inappropriate Content
08-04-2013
4:15 AM
I'm glad to post the result of my work for the Data Geek Challenge.
When I read about Data Geek, I was a little unsure if I could deliver a work like this without having almost no experience with data manipulation and creation of viewers that give meaning to these data.
However I was positively surprised, because with SAP LUMIRA the work has become easy and pleasurable. Also, make interesting discoveries about a mountain of information, only fosters the idea that there are many other facts hidden in this huge amount of data that humans produce everyday.
The subject

It was time to put the brain to work and decide what kind of information I would like to manipulate, and make SAP LUMIRA'S visualizations. This part was very easy.
I've chosen to work with Japanese census data to discover more about immigrants population in this fascinating country, and the reason is because I am passionate about Japan since childhood and also because my Japanese wife would be very helpful with language matters, since my skills on the all sort of kanjis are limited to almost zero. Also my 11 months daughter holds both nationalities, which makes me very proud. :razz:
It is far from a complex work, and may not look insightful for many people, however it was a great way to start demonstrating SAP LUMIRA in a easy way (for me at least).
I wanted to know how many Brazilians live in all Japanese cities or prefectures, how many of them were male or female and their ages. Also I wanted to compare the Brazilian population number with other nationalities to discover the position of them among others. With this data it comes together the population of other 9 nationalities of people that are living in Japan, what allowed me to show some insights for them in the end of this post. Also, if you wish, you can download it to check other ideas.
Background

More than one hundred years ago, many Japanese people came to Brazil to pursue a better life, since we had in Brazil plenty of land and coffee farms and no workforce to work in these lands. Brazilian government in an agreement with the Japanese government allowed many Japanese citizens to immigrate to this side of the planet, which made the quest a great adventure for those with enough courage to cross the world in a ship toward South America. Brazil has the most part of Japanese citizens decedents in the whole world, and in the late eighties they started doing the path back, going to Japan to work in all sort of factories and pursuing what everybody does, a better life. And for most of the walking creatures in this planet, a better life only comes with opportunities and hard work.
If you'd like to know more about this fascinating history, please head to http://en.wikipedia.org/wiki/Japanese_Brazilian it's a reliable post, and also there are many links for references. Now its time to have a look into the Brazilian story in Japan through some data captured from the Japanese census.
Data Source

All the data used in this work was captured in this website: http://www.e-stat.go.jp/SG1/estat/ListE.do?bid=000001034991&cycode=0
This website has all the work made by the census on all sort of counting. And if I have more time in the future, I will certainly explore these data in a wiser way. I can't imagine all the interesting and fascinating facts sitting there just waiting to be dug in. And as we know, Japan is highly developed country from where we can take some useful information. I've chosen the list of foreigners by nationality, age and gender containing in all Japanese prefectures, but unfortunately the newest file they have is from the census for 2010, which makes a huge difference after the 3/9/2011 disasters.
Data Preparation

The data that I acquired was a little bit confusing for me. First I stared at it and decided to open up directly in SAP LUMIRA, which was a good idea for realizing that it should be cleansed up a little bit.

The best way that I found that would work, was making all my attributes label and then put the data under them. The above screen shows how the spreadsheet looked like after some work on it. Around 22420 rows.
SAP LUMIRA

The fun part was in SAP LUMIRA, finding out that all the effort in looking for the data and cleansing it up worth. After the import of all my data, it was time to give some meaning to all that columns and rows.

First step was creating the Geography Hierarchies with Japan city names and unfortunately SAP LUMIRA couldn't recognize the prefecture or the city of many places in Japan. And they are not only small cities, I was surprised to see that major cities, with a huge economic relevance for the country was not recognized. So it may be fixed for the next release or some update somewhere. My maps will be missing information for these cities and prefectures.

My first visualization was made to discover the ranking of nationality by population in Japan. Since the data acquired by the census only reports the ten largest communities this was really easy to understand. It seems that on 2010 South Korean and Chinese were the biggest community in Japan, despite all the historical and current issues between these countries, it seems that a lot of Chinese and South Korean found in Japan a welcoming land. I used a column chart to demonstrate this data:
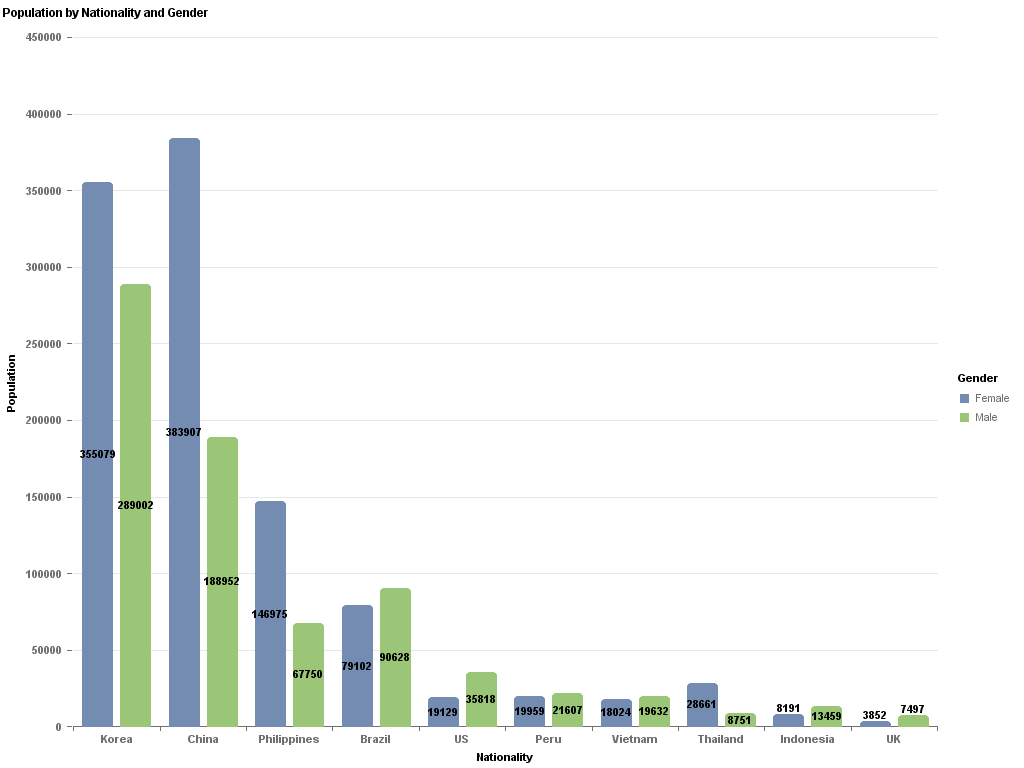
Before I narrowed my research on Brazilian population, I wanted first to locate the general immigrants population by gender. This one is also a column chart that demonstrates the huge gap between the amount of Chinese, Thai and Philippine ladies comparing with the men from their countries. For the US and UK citizens however, the men population amount is bigger. What would make a good business chance, aiming in the female community of these 2 nationalities?

Now looking in the Brazilian population only, I used a column chart (that seemed to work better for the type of data I was using) in a horizontal mode. Aichi prefecture turned out to be where most of Brazilian that are living in Japan relies on. Aichi prefecture has around 7.4 million inhabitants and its capital city is Nagoya (in this post represented separately), Aichi has 38 cities (including Nagoya) and many big Japanese companies (Like Toyota) are headquartered there. This fact also explains why many Brazilians are living in Aichi. I've never been there, but some friends told me that Aichi has many groceries that offer Brazilian products for the ones that miss the flavor of the country, if you think that they are not enough, Aichi would be a great place to open a business aiming the Brazilian community.

The same insight but now demonstrated with percentage and a donut chart. The data for the cities was ranked with the top 10 cities, using this function inside the population measure. This tool was great, because before, I was using a filter, which also works, but the rank thing gives me what I want to see much faster and with a reliable calculation.

The female population of Aichi is slightly higher than male, but in Shizuoka the game change a bit.

Now, looking into some data about age, I went to compare the kids population from 0 to 14 years old. I'm curious to know if these kids are being prepared to stay in Japan or to come back to Brazil...


For the both graphs above, it comes to light that also there are many young adults in Japan. It would be a good source of research to find out if these young community grew up in Japan, or left Brazil looking for a better paid jobs with or without their parents. I agree that in the 90's and early 2000, Brazil grow were very low and not so many opportunities have arose to the people in college age, but now, even the poorest may have the chance to go to college here, since government is offering a huge amount of scholarship, cutting taxes from private colleges so they can also offer some benefits.

The elderly population seems to be not so big, since only few went back to Japan after the first arrival here a century ago.

This heat map gives us an interesting insight about which age range is strongest represented in Japan separated by gender. Between 25 to 49 years old, both male and female are the biggest community. Again, comparing with Brazil, the young in this range would have more opportunity than the mature.

To me, this tree map view is one of the simplest way to show majority. Easy to understand and easy to build. As stated before, Aichi prefecture has the most of the Brazilian population in Japan, followed by Shizuoka, Gunma and Hamamatsu.
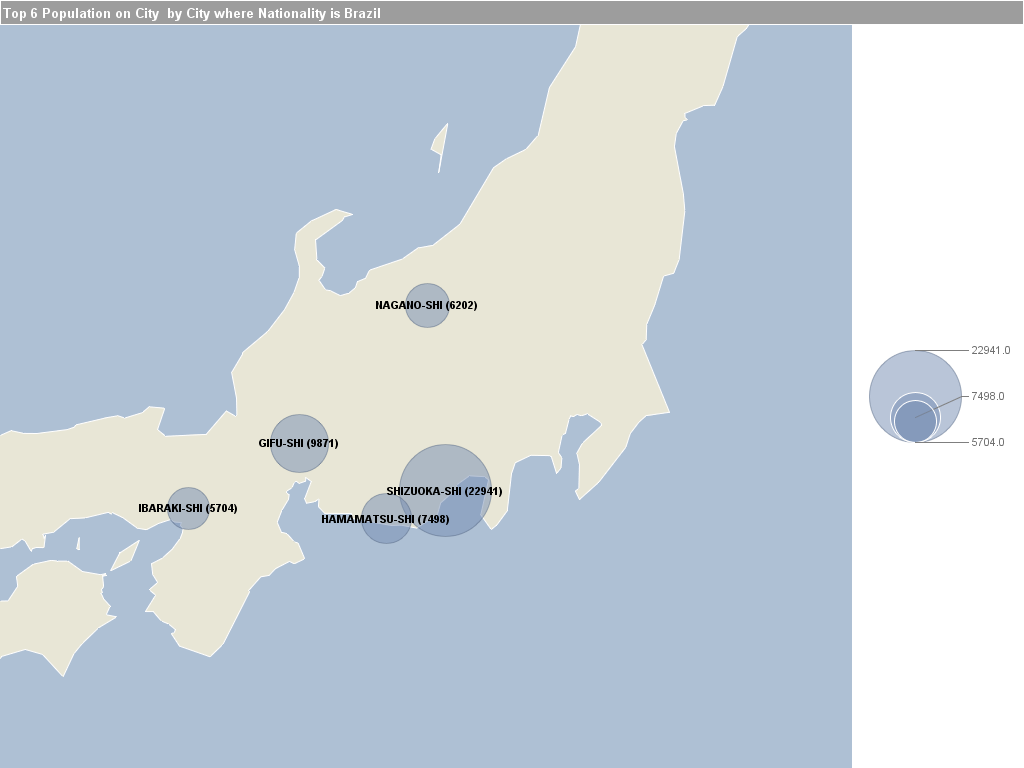
I couldn't use this Geographic Bubble chart as I wished because some cities are missing from SAP LUMIRA side. When it is fixed I want to organize my data with regions that allow me to see the map divided my the 8 informal regions.

In this heat map I wanted to give final insights including all nationalities that were available in the census data. In the picture above we have the population of Chinese and Korean highlighted in the cities of Tokyo and Osaka. Also few (comparing with the last two) Philippines and Brazil, for the prefecture of Aichi.

It seems to be that the women are taking the control, specially in Tokyo. Which would certainly make the things better if followed worldwide.

Twenties and early thirties are the majority in the country, when looked over all nationalities.

And this Geo Chart, that shows the ten nationalities most present in Japan. The label for China disappeared, but the one for South Korea is there. :smile:

And to close the work a cloud of tags. It's a more informal way to show majority.
Conclusion
As I said in the beginning, this work is not intended to be something complex in any way. It is just a modest post to show how I got along with SAP LUMIRA, and show how fantastic and easy can be to handle all the data available. I really had a lot fun working on this post. For the data I have used here, other people or association could use to make people lives better. For Brazil, I've seen many young coming back from Japan without school education, college or even a perspective to get a job and I think there are many ways to prepare these young to suffer less impact when the go back to the homeland.
Data sitting still in a Database, without meaning, is just data after all. SAP LUMIRA transforms data in a show of insightful information. Thanks for reading!
- SAP Managed Tags:
- SAP Lumira
3 Comments
You must be a registered user to add a comment. If you've already registered, sign in. Otherwise, register and sign in.
Labels in this area
-
"automatische backups"
1 -
"regelmäßige sicherung"
1 -
"TypeScript" "Development" "FeedBack"
1 -
505 Technology Updates 53
1 -
ABAP
14 -
ABAP API
1 -
ABAP CDS Views
2 -
ABAP CDS Views - BW Extraction
1 -
ABAP CDS Views - CDC (Change Data Capture)
1 -
ABAP class
2 -
ABAP Cloud
2 -
ABAP Development
5 -
ABAP in Eclipse
1 -
ABAP Platform Trial
1 -
ABAP Programming
2 -
abap technical
1 -
absl
2 -
access data from SAP Datasphere directly from Snowflake
1 -
Access data from SAP datasphere to Qliksense
1 -
Accrual
1 -
action
1 -
adapter modules
1 -
Addon
1 -
Adobe Document Services
1 -
ADS
1 -
ADS Config
1 -
ADS with ABAP
1 -
ADS with Java
1 -
ADT
2 -
Advance Shipping and Receiving
1 -
Advanced Event Mesh
3 -
AEM
1 -
AI
7 -
AI Launchpad
1 -
AI Projects
1 -
AIML
9 -
Alert in Sap analytical cloud
1 -
Amazon S3
1 -
Analytical Dataset
1 -
Analytical Model
1 -
Analytics
1 -
Analyze Workload Data
1 -
annotations
1 -
API
1 -
API and Integration
3 -
API Call
2 -
Application Architecture
1 -
Application Development
5 -
Application Development for SAP HANA Cloud
3 -
Applications and Business Processes (AP)
1 -
Artificial Intelligence
1 -
Artificial Intelligence (AI)
5 -
Artificial Intelligence (AI) 1 Business Trends 363 Business Trends 8 Digital Transformation with Cloud ERP (DT) 1 Event Information 462 Event Information 15 Expert Insights 114 Expert Insights 76 Life at SAP 418 Life at SAP 1 Product Updates 4
1 -
Artificial Intelligence (AI) blockchain Data & Analytics
1 -
Artificial Intelligence (AI) blockchain Data & Analytics Intelligent Enterprise
1 -
Artificial Intelligence (AI) blockchain Data & Analytics Intelligent Enterprise Oil Gas IoT Exploration Production
1 -
Artificial Intelligence (AI) blockchain Data & Analytics Intelligent Enterprise sustainability responsibility esg social compliance cybersecurity risk
1 -
ASE
1 -
ASR
2 -
ASUG
1 -
Attachments
1 -
Authorisations
1 -
Automating Processes
1 -
Automation
2 -
aws
2 -
Azure
1 -
Azure AI Studio
1 -
B2B Integration
1 -
Backorder Processing
1 -
Backup
1 -
Backup and Recovery
1 -
Backup schedule
1 -
BADI_MATERIAL_CHECK error message
1 -
Bank
1 -
BAS
1 -
basis
2 -
Basis Monitoring & Tcodes with Key notes
2 -
Batch Management
1 -
BDC
1 -
Best Practice
1 -
bitcoin
1 -
Blockchain
3 -
bodl
1 -
BOP in aATP
1 -
BOP Segments
1 -
BOP Strategies
1 -
BOP Variant
1 -
BPC
1 -
BPC LIVE
1 -
BTP
12 -
BTP Destination
2 -
Business AI
1 -
Business and IT Integration
1 -
Business application stu
1 -
Business Application Studio
1 -
Business Architecture
1 -
Business Communication Services
1 -
Business Continuity
1 -
Business Data Fabric
3 -
Business Partner
12 -
Business Partner Master Data
10 -
Business Technology Platform
2 -
Business Trends
4 -
CA
1 -
calculation view
1 -
CAP
3 -
Capgemini
1 -
CAPM
1 -
Catalyst for Efficiency: Revolutionizing SAP Integration Suite with Artificial Intelligence (AI) and
1 -
CCMS
2 -
CDQ
12 -
CDS
2 -
Cental Finance
1 -
Certificates
1 -
CFL
1 -
Change Management
1 -
chatbot
1 -
chatgpt
3 -
CL_SALV_TABLE
2 -
Class Runner
1 -
Classrunner
1 -
Cloud ALM Monitoring
1 -
Cloud ALM Operations
1 -
cloud connector
1 -
Cloud Extensibility
1 -
Cloud Foundry
4 -
Cloud Integration
6 -
Cloud Platform Integration
2 -
cloudalm
1 -
communication
1 -
Compensation Information Management
1 -
Compensation Management
1 -
Compliance
1 -
Compound Employee API
1 -
Configuration
1 -
Connectors
1 -
Consolidation Extension for SAP Analytics Cloud
2 -
Control Indicators.
1 -
Controller-Service-Repository pattern
1 -
Conversion
1 -
Cosine similarity
1 -
cryptocurrency
1 -
CSI
1 -
ctms
1 -
Custom chatbot
3 -
Custom Destination Service
1 -
custom fields
1 -
Customer Experience
1 -
Customer Journey
1 -
Customizing
1 -
cyber security
3 -
cybersecurity
1 -
Data
1 -
Data & Analytics
1 -
Data Aging
1 -
Data Analytics
2 -
Data and Analytics (DA)
1 -
Data Archiving
1 -
Data Back-up
1 -
Data Flow
1 -
Data Governance
5 -
Data Integration
2 -
Data Quality
12 -
Data Quality Management
12 -
Data Synchronization
1 -
data transfer
1 -
Data Unleashed
1 -
Data Value
8 -
database tables
1 -
Datasphere
3 -
datenbanksicherung
1 -
dba cockpit
1 -
dbacockpit
1 -
Debugging
2 -
Delimiting Pay Components
1 -
Delta Integrations
1 -
Destination
3 -
Destination Service
1 -
Developer extensibility
1 -
Developing with SAP Integration Suite
1 -
Devops
1 -
digital transformation
1 -
Documentation
1 -
Dot Product
1 -
DQM
1 -
dump database
1 -
dump transaction
1 -
e-Invoice
1 -
E4H Conversion
1 -
Eclipse ADT ABAP Development Tools
2 -
edoc
1 -
edocument
1 -
ELA
1 -
Embedded Consolidation
1 -
Embedding
1 -
Embeddings
1 -
Employee Central
1 -
Employee Central Payroll
1 -
Employee Central Time Off
1 -
Employee Information
1 -
Employee Rehires
1 -
Enable Now
1 -
Enable now manager
1 -
endpoint
1 -
Enhancement Request
1 -
Enterprise Architecture
1 -
ETL Business Analytics with SAP Signavio
1 -
Euclidean distance
1 -
Event Dates
1 -
Event Driven Architecture
1 -
Event Mesh
2 -
Event Reason
1 -
EventBasedIntegration
1 -
EWM
1 -
EWM Outbound configuration
1 -
EWM-TM-Integration
1 -
Existing Event Changes
1 -
Expand
1 -
Expert
2 -
Expert Insights
2 -
Exploits
1 -
Fiori
14 -
Fiori Elements
2 -
Fiori SAPUI5
12 -
Flask
1 -
Full Stack
8 -
Funds Management
1 -
General
1 -
General Splitter
1 -
Generative AI
1 -
Getting Started
1 -
GitHub
8 -
Grants Management
1 -
GraphQL
1 -
groovy
1 -
GTP
1 -
HANA
6 -
HANA Cloud
2 -
Hana Cloud Database Integration
2 -
HANA DB
2 -
HANA XS Advanced
1 -
Historical Events
1 -
home labs
1 -
HowTo
1 -
HR Data Management
1 -
html5
8 -
HTML5 Application
1 -
Identity cards validation
1 -
idm
1 -
Implementation
1 -
input parameter
1 -
instant payments
1 -
Integration
3 -
Integration Advisor
1 -
Integration Architecture
1 -
Integration Center
1 -
Integration Suite
1 -
intelligent enterprise
1 -
iot
1 -
Java
1 -
job
1 -
Job Information Changes
1 -
Job-Related Events
1 -
Job_Event_Information
1 -
joule
4 -
Journal Entries
1 -
Just Ask
1 -
Kerberos for ABAP
8 -
Kerberos for JAVA
8 -
KNN
1 -
Launch Wizard
1 -
Learning Content
2 -
Life at SAP
5 -
lightning
1 -
Linear Regression SAP HANA Cloud
1 -
Loading Indicator
1 -
local tax regulations
1 -
LP
1 -
Machine Learning
2 -
Marketing
1 -
Master Data
3 -
Master Data Management
14 -
Maxdb
2 -
MDG
1 -
MDGM
1 -
MDM
1 -
Message box.
1 -
Messages on RF Device
1 -
Microservices Architecture
1 -
Microsoft Universal Print
1 -
Middleware Solutions
1 -
Migration
5 -
ML Model Development
1 -
Modeling in SAP HANA Cloud
8 -
Monitoring
3 -
MTA
1 -
Multi-Record Scenarios
1 -
Multiple Event Triggers
1 -
Myself Transformation
1 -
Neo
1 -
New Event Creation
1 -
New Feature
1 -
Newcomer
1 -
NodeJS
2 -
ODATA
2 -
OData APIs
1 -
odatav2
1 -
ODATAV4
1 -
ODBC
1 -
ODBC Connection
1 -
Onpremise
1 -
open source
2 -
OpenAI API
1 -
Oracle
1 -
PaPM
1 -
PaPM Dynamic Data Copy through Writer function
1 -
PaPM Remote Call
1 -
PAS-C01
1 -
Pay Component Management
1 -
PGP
1 -
Pickle
1 -
PLANNING ARCHITECTURE
1 -
Popup in Sap analytical cloud
1 -
PostgrSQL
1 -
POSTMAN
1 -
Process Automation
2 -
Product Updates
4 -
PSM
1 -
Public Cloud
1 -
Python
4 -
Qlik
1 -
Qualtrics
1 -
RAP
3 -
RAP BO
2 -
Record Deletion
1 -
Recovery
1 -
recurring payments
1 -
redeply
1 -
Release
1 -
Remote Consumption Model
1 -
Replication Flows
1 -
research
1 -
Resilience
1 -
REST
1 -
REST API
2 -
Retagging Required
1 -
Risk
1 -
Rolling Kernel Switch
1 -
route
1 -
rules
1 -
S4 HANA
1 -
S4 HANA Cloud
1 -
S4 HANA On-Premise
1 -
S4HANA
3 -
S4HANA_OP_2023
2 -
SAC
10 -
SAC PLANNING
9 -
SAP
4 -
SAP ABAP
1 -
SAP Advanced Event Mesh
1 -
SAP AI Core
8 -
SAP AI Launchpad
8 -
SAP Analytic Cloud Compass
1 -
Sap Analytical Cloud
1 -
SAP Analytics Cloud
4 -
SAP Analytics Cloud for Consolidation
3 -
SAP Analytics Cloud Story
1 -
SAP analytics clouds
1 -
SAP BAS
1 -
SAP Basis
6 -
SAP BODS
1 -
SAP BODS certification.
1 -
SAP BTP
21 -
SAP BTP Build Work Zone
2 -
SAP BTP Cloud Foundry
6 -
SAP BTP Costing
1 -
SAP BTP CTMS
1 -
SAP BTP Innovation
1 -
SAP BTP Migration Tool
1 -
SAP BTP SDK IOS
1 -
SAP Build
11 -
SAP Build App
1 -
SAP Build apps
1 -
SAP Build CodeJam
1 -
SAP Build Process Automation
3 -
SAP Build work zone
10 -
SAP Business Objects Platform
1 -
SAP Business Technology
2 -
SAP Business Technology Platform (XP)
1 -
sap bw
1 -
SAP CAP
2 -
SAP CDC
1 -
SAP CDP
1 -
SAP CDS VIEW
1 -
SAP Certification
1 -
SAP Cloud ALM
4 -
SAP Cloud Application Programming Model
1 -
SAP Cloud Integration for Data Services
1 -
SAP cloud platform
8 -
SAP Companion
1 -
SAP CPI
3 -
SAP CPI (Cloud Platform Integration)
2 -
SAP CPI Discover tab
1 -
sap credential store
1 -
SAP Customer Data Cloud
1 -
SAP Customer Data Platform
1 -
SAP Data Intelligence
1 -
SAP Data Migration in Retail Industry
1 -
SAP Data Services
1 -
SAP DATABASE
1 -
SAP Dataspher to Non SAP BI tools
1 -
SAP Datasphere
9 -
SAP DRC
1 -
SAP EWM
1 -
SAP Fiori
3 -
SAP Fiori App Embedding
1 -
Sap Fiori Extension Project Using BAS
1 -
SAP GRC
1 -
SAP HANA
1 -
SAP HCM (Human Capital Management)
1 -
SAP HR Solutions
1 -
SAP IDM
1 -
SAP Integration Suite
9 -
SAP Integrations
4 -
SAP iRPA
2 -
SAP LAGGING AND SLOW
1 -
SAP Learning Class
1 -
SAP Learning Hub
1 -
SAP Odata
2 -
SAP on Azure
1 -
SAP PartnerEdge
1 -
sap partners
1 -
SAP Password Reset
1 -
SAP PO Migration
1 -
SAP Prepackaged Content
1 -
SAP Process Automation
2 -
SAP Process Integration
2 -
SAP Process Orchestration
1 -
SAP S4HANA
2 -
SAP S4HANA Cloud
1 -
SAP S4HANA Cloud for Finance
1 -
SAP S4HANA Cloud private edition
1 -
SAP Sandbox
1 -
SAP STMS
1 -
SAP successfactors
3 -
SAP SuccessFactors HXM Core
1 -
SAP Time
1 -
SAP TM
2 -
SAP Trading Partner Management
1 -
SAP UI5
1 -
SAP Upgrade
1 -
SAP Utilities
1 -
SAP-GUI
8 -
SAP_COM_0276
1 -
SAPBTP
1 -
SAPCPI
1 -
SAPEWM
1 -
sapmentors
1 -
saponaws
2 -
SAPS4HANA
1 -
SAPUI5
5 -
schedule
1 -
Script Operator
1 -
Secure Login Client Setup
8 -
security
9 -
Selenium Testing
1 -
Self Transformation
1 -
Self-Transformation
1 -
SEN
1 -
SEN Manager
1 -
service
1 -
SET_CELL_TYPE
1 -
SET_CELL_TYPE_COLUMN
1 -
SFTP scenario
2 -
Simplex
1 -
Single Sign On
8 -
Singlesource
1 -
SKLearn
1 -
Slow loading
1 -
soap
1 -
Software Development
1 -
SOLMAN
1 -
solman 7.2
2 -
Solution Manager
3 -
sp_dumpdb
1 -
sp_dumptrans
1 -
SQL
1 -
sql script
1 -
SSL
8 -
SSO
8 -
Substring function
1 -
SuccessFactors
1 -
SuccessFactors Platform
1 -
SuccessFactors Time Tracking
1 -
Sybase
1 -
system copy method
1 -
System owner
1 -
Table splitting
1 -
Tax Integration
1 -
Technical article
1 -
Technical articles
1 -
Technology Updates
14 -
Technology Updates
1 -
Technology_Updates
1 -
terraform
1 -
Threats
2 -
Time Collectors
1 -
Time Off
2 -
Time Sheet
1 -
Time Sheet SAP SuccessFactors Time Tracking
1 -
Tips and tricks
2 -
toggle button
1 -
Tools
1 -
Trainings & Certifications
1 -
Transformation Flow
1 -
Transport in SAP BODS
1 -
Transport Management
1 -
TypeScript
2 -
ui designer
1 -
unbind
1 -
Unified Customer Profile
1 -
UPB
1 -
Use of Parameters for Data Copy in PaPM
1 -
User Unlock
1 -
VA02
1 -
Validations
1 -
Vector Database
2 -
Vector Engine
1 -
Visual Studio Code
1 -
VSCode
1 -
Vulnerabilities
1 -
Web SDK
1 -
work zone
1 -
workload
1 -
xsa
1 -
XSA Refresh
1
- « Previous
- Next »
Related Content
- Solution for Rubik’s Cube of E-Invoicing in SAP Document and Reporting Compliance in Technology Blogs by Members
- SAP Japan Low-Code No-Code Hackathon for Partners Interview Blog Vol.3 ~SAP Solution Extension Division, Grand Prize Winner~ in Technology Blogs by SAP
- Business and Digital Trends in the Chemical Industry: Sourcing and Procurement in Technology Blogs by SAP
- Partner innovations in the forefront to automate business processes faster with SAP Process Automation in Technology Blogs by SAP
- SAP BTP led Partner innovations for SME customers in Technology Blogs by SAP
Top kudoed authors
| User | Count |
|---|---|
| 6 | |
| 5 | |
| 5 | |
| 5 | |
| 5 | |
| 4 | |
| 4 | |
| 4 | |
| 3 | |
| 3 |