Skip to Content
Author's profile photo Former Member

SAP Lumira 1.0 SP11 – New features at a glance part 2

SAP Lumira 1.0 SP11 – New features at a glance part 2

By Manikandan Srinivasan, Andreas Krause and John Mrozek.

Part 2 highlighting some of the planned new features in the soon to be released SP11 Lumira Desktop.

5. Visualization Extensions

CVOM – which is also referred to as SAP HTML5 Visualization, powered by CVOM – is a visualization engine designed to work with HTML5 technology to create different visualizations. CVOM (Common Visual Object Modeler) also provides the ability to help partners and developers to build their own visualizations in SAP Lumira.

Steps to deploy sample custom charts that are packaged with SAP Lumira:

Sample custom charts are installed with SAP Lumira in the following folder: \<SAP Lumira Install>\Desktop\Samples

The sample viz.ext.flagbar must be used with its own shipped data set, as it can not be exploited correctly using other data. It is only an example to show 

the possibilities of the type of chart. Ensure that you acquire the data from the following data source when using this chart: \<SAP Lumira Install>\Desktop\chartExtensions\viz.ext.flagbar\examples\sampledata\sampledata_flagbar.xls

  1. Close SAP Lumira.
  2. Go to the folder: \<SAP Lumira Install>\Desktop\Samples\.

The following folders are installed with the application. These folders contain the javascript CVOM chart extensions, datasource, manifest file, and the chart feed definition:

• viz.ext.flagbar

• viz.ext.samplesbar

Note: See Related Topics for a description of the files in each folder, and how you can use the sample chart extensions to build new custom charts.

                3. Copy the sample folders to the following folder: \<SAP Lumira Install>\Desktop\ChartExtensions\.

              4. Restart SAP Lumira.

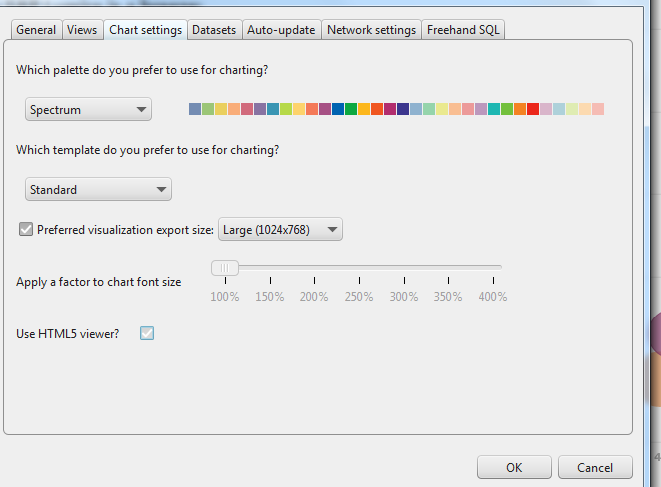
              5. Select File > Preferences, and then click the Chart Settings tab.

              6. Select the Use HTML5 viewer ? check box and then click OK.

/wp-content/uploads/2013/06/usehtml5_227217.png

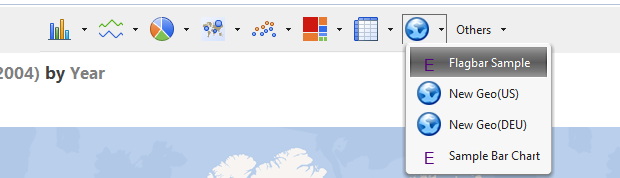
The sample custom charts appear in the new family E in the chart bar.

newFamily.png

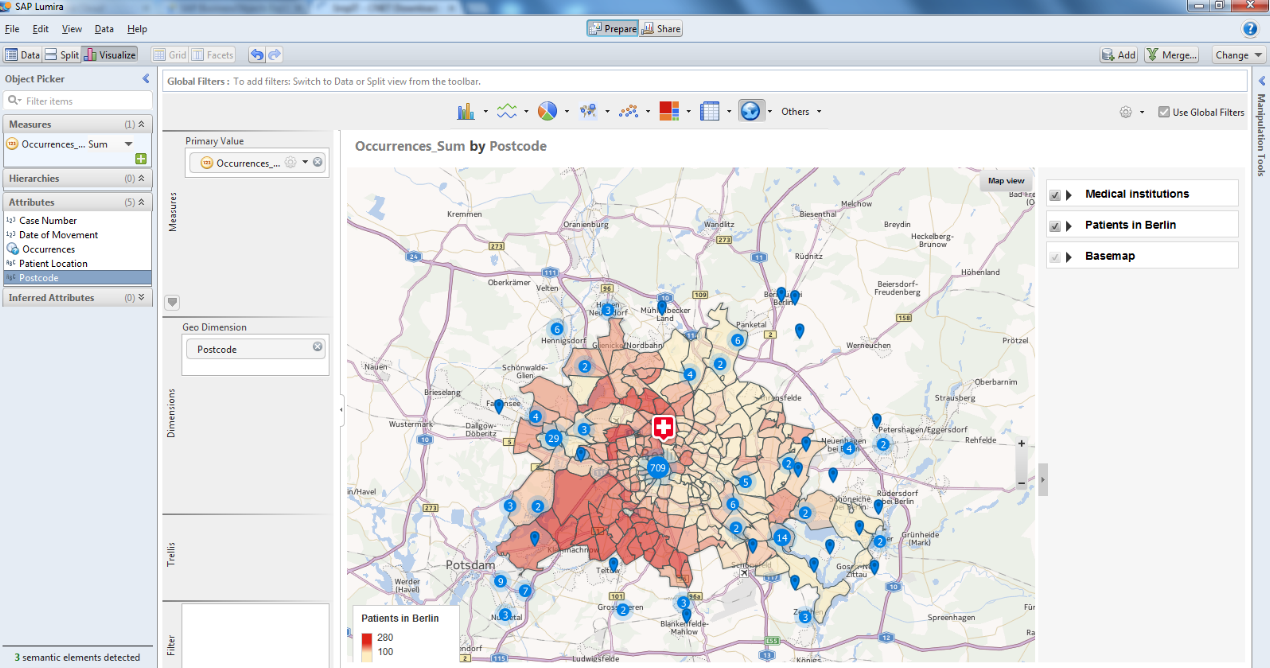
Example of a custom geo map below:

/wp-content/uploads/2013/06/gmapzample_227234.png

6. SAP Lumira Cloud Integration:

Sharing Lumira .svid documents with others via the Lumira Cloud

Lumira Cloud enables sharing captivating discoveries with colleagues.

  1. I have my document and select File | Save As. /wp-content/uploads/2013/06/savas_227235.png
  2. Now select the Save to SAP Lumira Cloud option. Here you can share with other users and give them different access levels. /wp-content/uploads/2013/06/savlum_227236.png
  3. The content is now available for consumption and further analysis in the SAP Lumira Cloud section of the SAP Lumira desktop application. /wp-content/uploads/2013/06/consumeshun_227241.png

Publish SAP Lumira Datasets to SAP Lumira Cloud

With SAP Lumira you can easily mash-up multiple datasources such as an excel spreadsheet and a universe. You can then publish them to the cloud for future analysis. In this example, I am just using a single HANA Calculation View.

  1. I select my dataset and choose the Publish to Lumira Cloud option. /wp-content/uploads/2013/06/ptol_227242.png
  2. I then login with my email address.                                         

                  /wp-content/uploads/2013/06/myaddy_227249.png

              3.Next I give information about my dataset.

                 /wp-content/uploads/2013/06/mysetin_227250.png

                4) The Dataset is now published to SAP Lumira Cloud.

Explore Datasets that have been published to SAP Lumira Cloud

  1. I log in @http://cloud.saplumira.com and see the published dataset. I click on the name of the dataset and am presented this view where I can explore and analyze the data & I can quickly, visually see how each state performed by year. /wp-content/uploads/2013/06/splored_227257.png

Scheduling of refresh documents with optional publication to Lumira

  1. In File | Preferences, select the Enable SAP Lumira Agent option. You’ll need to close and then re-launch Lumira Desktop. /wp-content/uploads/2013/06/nable_227261.png

           2. You will now see a Lumira Agent icon. It will remain even if you close SAP Lumira Desktop.

                 /wp-content/uploads/2013/06/agento_227262.png

            3. Right click on the icon and select Open SAP Lumira Agent.

                 /wp-content/uploads/2013/06/openag_227263.png

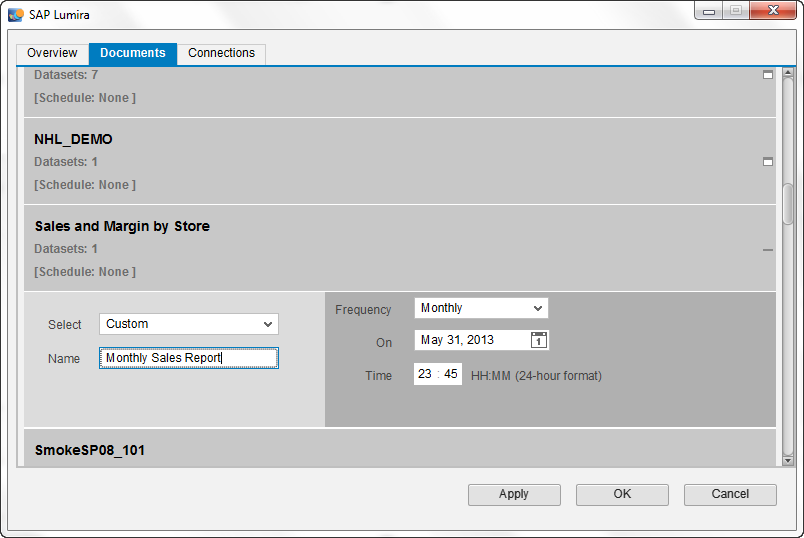
            4. Save the username and password for connections that are used by the documents you want to schedule in the Connections tab. This information only needs to be entered once.

                /wp-content/uploads/2013/06/spazz_227264.png

             5. Set the frequency and other information and the report will now be scheduled.

                /wp-content/uploads/2013/06/schequency_227266.png

              6. The documents are updated based on a refresh of the datasource on both the Desktop and in the Cloud.

Assigned Tags

      15 Comments
      You must be Logged on to comment or reply to a post.
      Author's profile photo James Rapp
      James Rapp

      John, thanks for sharing this comprehensive overview of new features in SP11.  Great plug for eFashion on HANA too 🙂

      I hope to see more of these going forward as it can be challenging to keep up with all the new features showing up in Lumira!

      Author's profile photo Denis Konovalov
      Denis Konovalov

      how are documents updated in both places ?

      does the agent sends something to the cloud and to desktop ?

      Author's profile photo Former Member
      Former Member

      Denis, you can select datasets and schedule a refreshing (or recurring ones) so the local datasets get sent to the cloud.

      Author's profile photo Denis Konovalov
      Denis Konovalov

      Hello Jay,

      Could you please expand on how it is done ?

      Let's say I have a local data set and one published to the cloud.

      I schedule both - what happens next ?

      Author's profile photo Former Member
      Former Member
      Blog Post Author

      Hi Denis,

      We refresh on the Lumira Desktop machine and then save that to the cloud.

      Author's profile photo Denis Konovalov
      Denis Konovalov

      so the schedule agent replaces the existing set with refreshed one - no historical instances etc ?

      Author's profile photo Former Member
      Former Member

      After refreshing the old dataset in the cloud should be overwritten. 

      Author's profile photo Former Member
      Former Member

      Hello John,

      Thanks for this post ! Do you possibly know how the custom Geo map is created ? I've heard of CVOM Javascript Framework but nothing more for the moment..

      Is there any documentation for the moment about this ?

      Regards,

      Nicolas

      Author's profile photo Former Member
      Former Member

      Hi Nicholas,

      Try visiting this http://viz.dhcp.pgdev.sap.corp/viz/wiki 

      You should be able to find how to create an extension chart type.

      Thanks,

      Jay

      Author's profile photo Former Member
      Former Member

      Hi Jay,

      Thanks for your answer ! Unfortunately I'm unable to access the URL you provided..Do I need special access rights or something ?

      Thanks in advance,

      Nicolas

      Author's profile photo Former Member
      Former Member

      Hi Jay,

      I also tried to access the URL but it does not seem to work ?!? is this an internal URL ?

      I am actually trying to enhance and use the Lumira Geovisualization.

      Can you provide some more ifnormation regarding which componets (cvom) to be used ?

      I've described my tries in this post (http://scn.sap.com/thread/3498277)

      Thanks and best regards

      Manfred

      Author's profile photo Birte Hildebrandt
      Birte Hildebrandt

      When will this feature be available in SAP PA?

      Thanx in advance,

      Birte

      Author's profile photo Clarissa Dold
      Clarissa Dold

      Hi Birte,

      these featurs are already available in PA, since they are sharing the same codeline, but some of those need to be manually activated through the Preferences as outlined above.

      cheers,

      Clarissa

      Author's profile photo Former Member
      Former Member

      Excelente! Mil gracias!

      Author's profile photo Former Member
      Former Member

      Hi, I´m a bit late on this, but I´m really interested to know

      how your did ths Coropleth map of Berlin.

      Any chance to look into the file(s)?


      Cheers