Now it's possible to easily profile ABAP development objects e.g. Transactions, Programs, Web Dynpro Applications, Function Modules and Unit Tests of Global Classes. Choose "Run -> Profile ABAP Development Object" from the menu or simply press "Alt+F9".
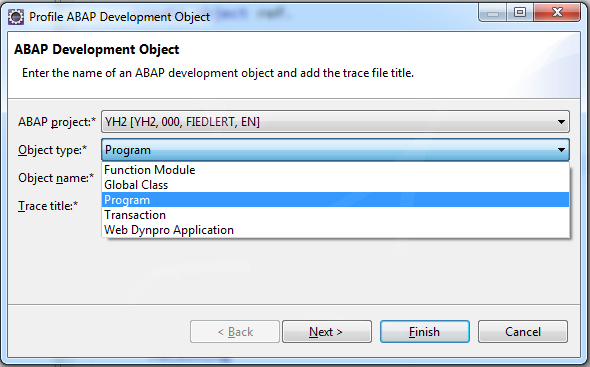
One the first screen you can select the object you want to trace. The second page is optional and can be used to fine-tune the trace parameters. It is defaulted with the trace parameters that are stored in your preferences. When pressing "Finish" the ABAP development object is executed.
The resulting trace file can be found in the "ABAP Traces" view:

You can see all your current traces from different ABAP projects with their header information like execution date and time, traced objects and so on. Via the user filter you can also display traces from other users. You can display one of the listed traces just by double-clicking on the item in the list. This opens the trace details view:

On the Overview page you can see the header data of the trace and some graphical visualization of the runtime distribution which gives you a first hint for your performance analysis. Hit List and Call Tree view are very similar to GUI based tracetool SAT. The Database Access View gives you a detailed list of the database interaction of your ABAP programm.
The ABAP Profiler in Eclipse comes along with a Graphical Call Tree which visualizes the trace events known from its Hit List and Call Tree.

The width of the blocks indicates the quantity of runtime consumed and their color shows which type of call they represent. The colors are configurable and you can also define individual coloring rules by trace event name patterns. Tooltips give you more detailed call information. Moreover, you can navigate from there to the Hit List or the call position in the source code. Call patterns which are run through repeatedly can be detected at a glance. Besides that, you can easily check the depth of the call stacks during runtime. And last but not least you can zoom in and out in order to see more or less details, depending on your needs. When you click at a trace event, all events with the same name (e.g. call of same method) are highlighted so that you see all locations simultaneously, where it comes into play.
