Hello everyone,
Here I would like to share what i tried in order to implement the maps in Design Studio report.I am sure that the developers of Design Studio will provide various maps components in future.Untill then this could be a workaround for smaller set of data,but this cant be used for productive usage where we have more number of country values(in such cases,this approach may lead to lot of coding).
Lets move on...
1.Create two data sources on top of same Query or HANA View
Insert a cross tab and assign it to the Data Source 2 which has defined with Initial view.So you will get the following...
Edit Initianl View Pane :

Cross tab in the canvas :

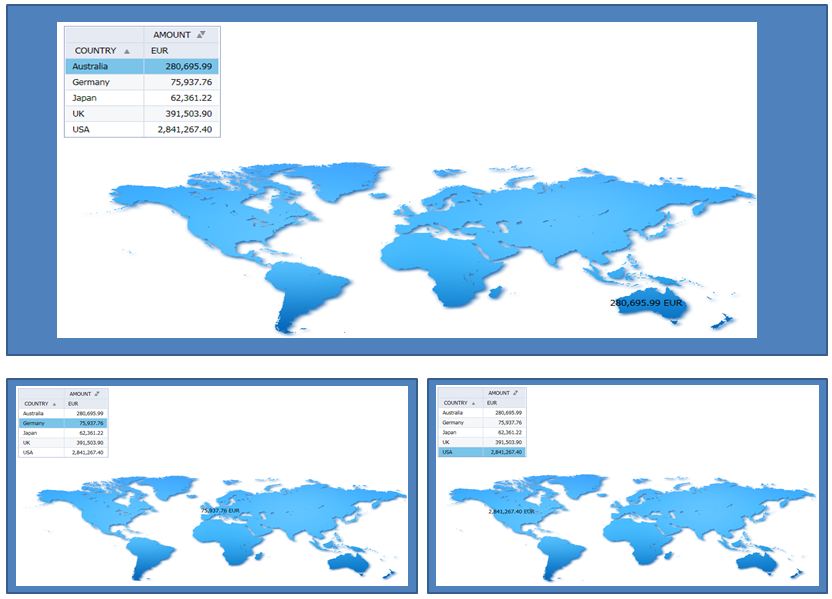
2. Now place the Grid Component and place the Map image in it along with some text elements to show the Measure(AMOUNT in this case) values on click.You can write some CSS Style coding for the text elements based on your need.
You can also place each text element in Pop up element and assign some predefined animations,to make it even more attractive at runtime.

3. Now in the "On Select" event of Cross Tab,write the following code...

Here the "IF" condition is written for each value of a country,thatswhy I meantioned before that this may lead to lot of coding depending on the value of an attribute.
4. Save and Execute the report.Now selecting the respective country in Crosstab,will show the AMOUNT in the map.
Hope this helps.
Comments are always welcome.Thanks.
Rgds,Murali
