My experience with SAP BO Design Studio on HANA
Hello SCNers,
In this post, I would like to share my experience with SAP BO Design Studio on HANA.
Before jumping into Desing Studio,I had a fair experience on WAD(Web Application Designer) and Xcelsius(now its Dashboard Design).Dashboard is little or i would say more advanced compare to WAD, in terms of Visualisation capabilities.
One can impress the viewers(the information consumer) with the visually enriched Dashboard.But I feel that the developer who creates the dashboard should have a good amount of patience and knowledge to work with the different components,Excel formulas,Mappings,etc to develop a good and appealing dashboard.
Now its a time to move on with the new tool(SAP BO Design Studio) which I see, a kind of successor to Dashboard.
I went through some of the SCN pages about this applicaiton and came accross a blog post http://scn.sap.com/community/businessobjects-design-studio/blog/2012/11/17/sap-businessobjects-design-studio–your-first-steps-to-find-it-download-it by “Tammy Powlas”.Simply followed the instructions (which are nicely written) and now the application is sitting in my laptop.I am good to go with that.
Quick installation,Landing Welcome page and Instant Links to various documentations pushed me to create some impressive visualization on top of SAP HANA.
Here we go…
1. Launched Design Studio and created a new analysis application targetting “Desktop Browser” with Blank Template option
2. Inserted a new Data Source(an Analytical View created using SAP HANA Studio) and made the initial selection of Dimensions and Measures
3. Now its time to place the components and do mapping.Actually i wanted to give a better look and hence placed an image component and assigned image.I was trying to find the direct “Browse…” button to assign an image,but finally came to know that the image has to be placed in the reporsitory location in order to map.Since the image is going to act as a backgorund,I reduced the Opacity.
4. Once the background is done,placed the required components like Cross tab,Button,Charts in the canvas
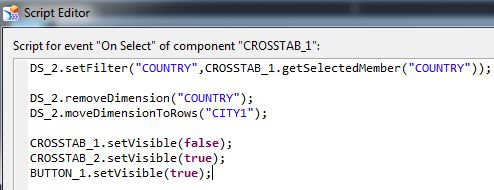
5. Mapped the Data Source in each of these components.Then I wanted to make these components to interact with themselves using “On Select” property.
For Eg: Clicking any row in the Cross tab should make the display accordingly in the charts.So I wrote the following simple scripts in the Editor.
6. There is a very nice Container Component called “Pagebook” with the help of this,you can make a sliding effect.I included that as well in my report.Finally gave the Title for the report with SAP Logo and changed the theme.
7. On publishing the report in the browser or though QR Code,here is the final design
8. Various kind of drill down is also possible with the help of “On Select” property
Drill down by Country -> Region -> City -> Customer -> Material and so on….
Overall it’s really a nice application for the developers who want to create and present the business data more visually and to make quick business decisions,ofcourse everything runs on HANA 🙂
Thanks for reading and comments are welcome!
Rgds,Murali
Nice blog and I hope you blog more
Sadly, no HANA here where I work...and I haven't made time to set up in the cloud.
Tammy
Hi Tammy,
Can I work standalone without logging in to server. We are not planning to install design studio on any server as of now. I want to first install on my laptop and create standalone application and run on desktop browser. Is thsi possible.
Regards,
Nanda Kishore
You will need a data source as that is part of the features of WYSIWYG
You can try without connecting but I am not sure how far you will get in the Design portion.
Good luck
Hi Murali,
Great work on the blog. I had a question for you and anyone who might read this. Do you know of any way, of getting data labels on the charts. That is if its a column chart is it possible to show values of the data on top of the columns or if its a pie chart is it possible to show percentages or even values in the chart?
Regards,
Swaroop
Hi Swaroop,
in the current version (1.0 SP2) there aren't too many possibilities to edit the charts.
In the roadmap we see that they are working on that and it should get better. But now i think the things you want (values on top of oclumns, % in the chart) are not possible.
There was just a 1.1 webcast with new possibilties mentioned. Look out for any reports of Tammy about the developments and you will get a view how far they have advanced.
kind regards,
Jeroen
Hi all,
I am connecting to HANA through Design Studio. I am able to only add an analytical view as a datasource. I am not able to add a calculation view or attribute view. Is this possible? I checked some documentation and they do mention that calculation views can be added.
Do you have any inputs?
Regards,
Sathish.
Hi,
Design studio allows only Analytical and Calculation views. However if the calculation view has an input parameter, it cannot be added.
Hi Swaroop,
Thanks for your response. I was able to add an analytical view as a datasource. But I could not add any calculation view. It simply not showing in the list. I ran the calculation views in HANA studio and they seem to be active and dont find any errors. Am I missing anything?
Regards, Sathish
Do you have input parameters in your calculation view?
No input parameters. These views are done graphically. The calculation views joins couple of analytical views.
The Analytical View must also be set to be a Multi Dimensional Report. Check the properties tab in HANA studio.
Nice Blog - thanks!
Hi Muralikrishnan ,
Very nice blog o BO Design Studio can you please help on how did you create the drill down effect .I am unable to get the coding.
Kind Regards,
Priyanka
Hi,
Thanks.
The drill down achieved by making the cross tab invisible which has clicked dimension and then showing the cross tab which has drilled down data.Accordingly the dimension removed from data source and drilled down data's dimension added.
Diagram No:5(Script Editor) does that.
Rgds,
Murali
Thanks ..i'll implement it and check the same.
Kind Regards,
Priyanka
Nice blog Murali. Too bad that I missed it this blog and I wish I read this blog earlier before trying out my 1st Design Studio app few months ago. Thanks !
Great post Murali, keep 'em coming...
Hi Murali ,
Good Post for the navigation of dimensions in different level.
For the Region - . Country - > State - > Material , How would be the code
In the above example no:5 diagram shows Hide and Unhide crosstabs and charts.
Any Idea..
Is it possible to do the above approach in DS
Hi Murali,
If we are creating dashboards based on Infoproviders directly can we do calculations as we do in BEx ?
Hi Murali,
Can we automate pagebook index selections??
for example i have 3 pages and 3 images in my welcome page. What I want to do is, once i opened my application and without clicking anything I just want that 3 images fade-up one by one and repeat the same.
Is that possible in script? please let me know if it possible
Thanks in advance
Regards
Mathivanan
Great help. Thank you