Hi Friends,
Now I want to share information about RunningSum() function in Webi Intelligence.
Here is a small example.
You have a report that shows the Actual & Plan values for each Category for the current Fiscal Year monthly and YTD.
The Data is coming from SAP BI on an monthly basis. Here you need to find the YTD values on each month for each category.
That means YTD of May = YTD of April + MTD of May and YTD of June = YTD of May + MTD of June
Using RunningSum() function you can acheive this.
The syntax is = RunningSum(measure[;Row|Col][;(reset_dims)])
So you have Dimension objects as FY Year, Period, Category, and Measure objects as Sales-Actual, Sales-Plan, Rev-Actual, Rev-Plan
Now i want the data to be displayed as
| | APRIL | MAY | JUNE |
| FY Year | Period | Type | Sales Actual | Sales Plan | Rev Actual | Rev Plan | Sales Actual | Sales Plan | Rev Actual | Rev Plan | Sales Actual | Sales Plan | Rev Actual | Rev Plan |
| 2013 | MTD | DIST | 547.85 | 529.01 | 277.52 | 337.77 | 565.84 | 523.62 | 289 | 334.82 | 583.43 | 570.41 | 294.7 | 362.53 |
| 2013 | YTD | DIST | 547.85 | 529.01 | 277.52 | 337.77 | 1,113.69 | 1,052.63 | 566.52 | 672.59 | 1,697.12 | 1,623.04 | 861.22 | 1,035.12 |
| 2013 | MTD | GEN | 443.09 | 459.73 | 237.39 | 198.37 | 455.25 | 469.72 | 240.94 | 200.19 | 473.8 | 473.97 | 263.99 | 217.38 |
| 2013 | YTD | GEN | 443.09 | 459.73 | 237.39 | 198.37 | 898.34 | 929.45 | 478.32 | 398.56 | 1,372.14 | 1,403.42 | 742.31 | 615.93 |
| 2013 | MTD | TRAN | 0 | 0 | 24.73 | 24.73 | 0 | 0 | 24.73 | 24.73 | 0 | 0 | 19.73 | 24.73 |
| 2013 | YTD | TRAN | 0 | 0 | 24.73 | 24.73 | 0 | 0 | 49.46 | 49.46 | 0 | 0 | 69.19 | 74.18 |
To achieve this task you need to create a crosstab with fields FY Year in 1st column, Period in 2nd Column, Category in 3rd Column and Months in 4th column.
Also create a variable with YTD Sales Actual as shown below
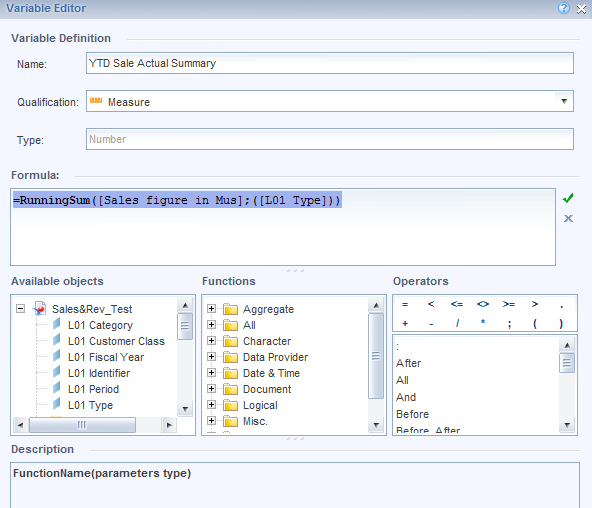
I passed Measure object (Sales figure in MUs) and Dimension object (LO1 Type) as i want the values to be reset to every Category.
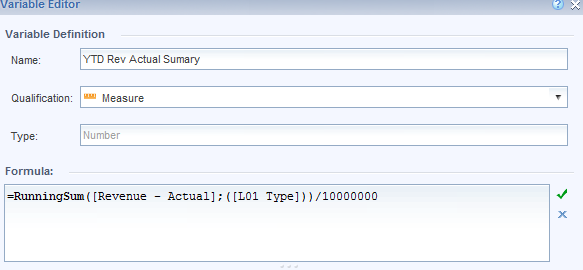
Like wise create variable for rest of the measures like Sales-Plan, Rev-Actual, Rev-Plan as shown below( here I am showing for Rev-Actual)
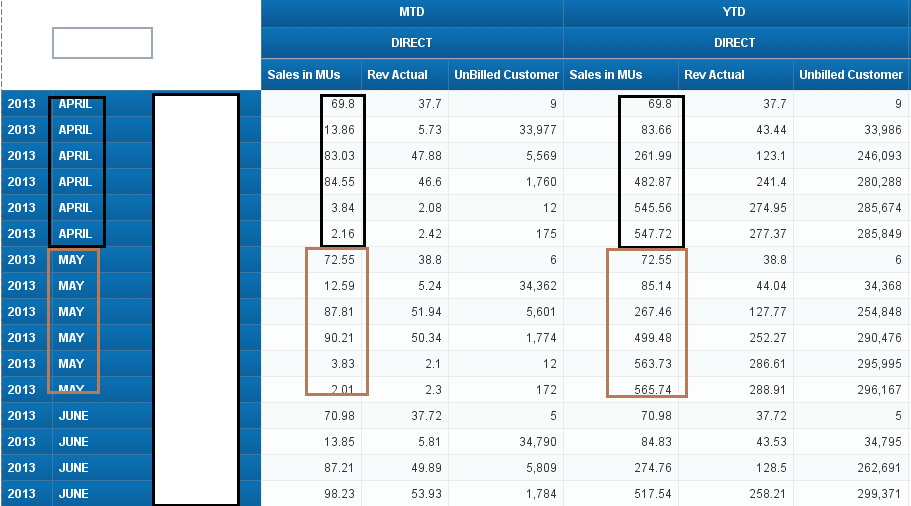
Now, the output will be as shown below

if you are not using the dimension object in the runningsum() function as shown below.

Then the output would be like this as shown below which is giving the wrong YTD values for GEN and TRAN categories.

Also if you want for Monthwise reset in the runningsum() function give Dimension Object [month] as shown below.

Then the output will be as shown below with clear difference as marked in colored rectangles as discussed above the formula about the calculation of YTD values
Hope this might help for people who need better clarity about the usage of the function.
Note: I divided the formula with 10000000 value as you see in formula editor. It is because I want to show the values in Rs. Crores.
Cheers
RAM
