Hi,
Here i would like to show how I used SAP Visual Intelligence to generate statistics and was able to determine where sale would increase in the next quarter.
I used a data set of the Clothes that were sold around the Globe, with different type of Clothes like Jeans, T-Shirts, 2 Pocketed Shirts etc.
Based on the data set and with the help of SAP Visual Intelligence I was able to determine graphically where the sales where high across Globe and where i can increase my sales with what kind of or type of Clothes.
And in the end, this was the conclusion : London was the highest point of sale and next was Mumbai!
Here are the screenshots of the data set that was analyzed using SAP Visual Intelligence,
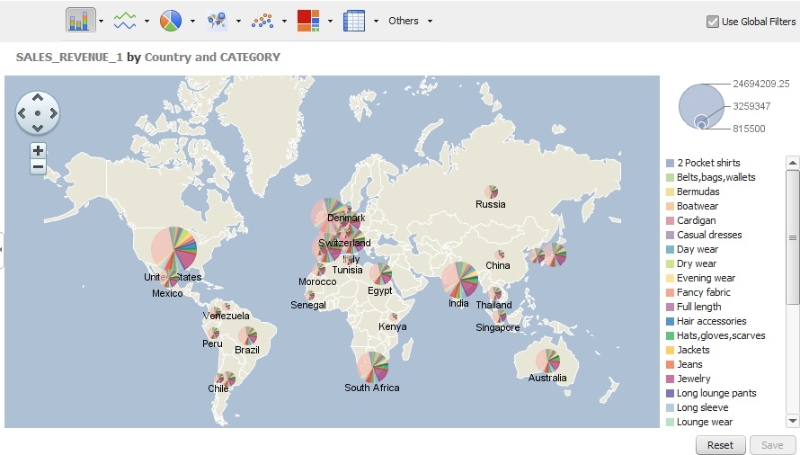
The above image let us know what kind of Clothes where sold across the Globe in various cities.
The right side bar let us know different category of clothing and helps us to determine the market which would boom that kind of industry [clothing]

Using the image one it was difficult to determine which industry [city] was booming and where i can go ahead and sell those kinda clothes, using this graph i was able to determine London had the highest point of sale at any given point of time and any variety of clothes and Mumbai was the second.
Regards,
Abhishek
