Even being part of an IT Organization, my passion for Business Intelligence drives me always to think about business value and business empowerment. It’s painful for me to see End Users and Power Users forced to perform tasks that have low business value, like coding, scripting or spending days in manual and repetitive actions, to find what they need..
SAP Visual Intelligence is a perfect example where my passion is particularly satisfied - offering the opportunity to our Business Analysts to gather all the data they need, perform the manipulations on the data to create the exact visualizations that show the meaningful information. All of this is done autonomously, with no support from IT, with no technical knowledge – and it’s reproducible.
I have myself been using this tool quite a lot over the past few months; in the specific context of Excel. Even in IT, not everything is managed in robust applications and we need sometimes a framework that allows us to be flexible and agile like any line of business.
Here are a few examples where I think SAP Visual Intelligence brings amazing help to create in a short sequence of simple steps things that would normally take hours. This is not exhaustive but intended to give you an idea of the very large range of use cases.
Group and format data
Who has never seen in shared excel files, these fields of free text where everyone tries to follow the same spelling but cannot 100% homogeneous?
This data can only be useful when they are clustered and formatted properly.

With SAP Visual Intelligence, this can be done in a short sequence of simple actions:
a. Turn to Upper Case, to keep one single type.

b. Group values as per necessity – for example NOT APPLICABLE / NA / N/A should be grouped under one unique value.

c. Prefix all Line Of Business related projects with « LOB » to follow the same naming convention
d. Finally, it takes less than 2 minutes and no coding at all to perfom all these activities, reaching the result that you can leverage for reporting :

Very interestingly, it highlights clearly that we as a team have to align on the “UNDEFINED” cases: 1.) if this is because Not Applicable or 2.) Not yet Available.
Extract information out of a field of data
Quite often we also see the scenario where a field contains a mixture of numbers and text; especially when you want to add comments to the numbers or the unit. While it may be very important for reading, it makes it very complex to get this as a data point for reporting. Here is an example where the field indicates an effort estimation in number of man days:

a. Starting by splitting the column to isolate the portion where numbers have been entered:
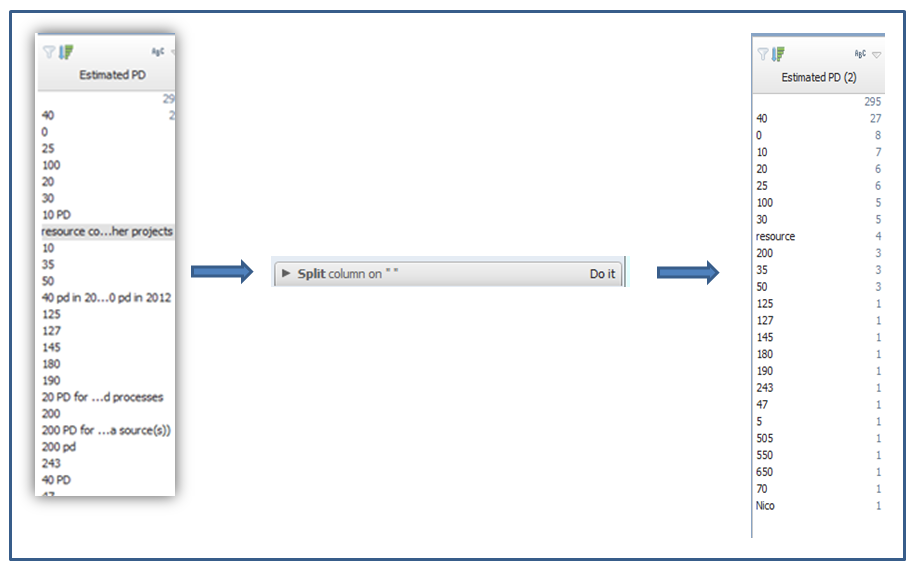
b. You get a new column – from which you just need to convert to a Number, using the very basic formula language (offering auto completion help!):

c. You get a new column with only numeric values, wherever there are. Just renaming this column, gives you then the possibility to integrate this as a new measure in your analysis.

Dates – changing your life
I cannot remember how often I’ve had to create complex, embedded formulas to extract out of a date its different components – Year / Quarter / Month / Day
It would have been one of my first expectations that a tool driven by empowering End Users to manipulate the data, would address this important and challenging need.
SAP Visual Intelligence:
- Includes a “semantic intelligence” detecting automatically columns looking like dates
- Offers a functionality to automatically create all levels of hierarchy of date type columns
As a result, in one click, with no technical formula, all elements are automatically generated.


No more LOOK-UPs !
Interviewing a number of Analysts from various Organizations, a very common use case is that the sheet of facts is missing some elements of qualification that are coming from a separate table that has been added manually in a separate Tab.
This is a level of complexity that usually requires time to write the right formula (e.g. =VLOOKUP(H92;Bunsiness_Ownership!A:B;2;FALSE) ) and a certain technical expertise.
With the possibility to merge several datasets, SAP Visual Intelligence brings back the level of complexity to simply understand how my data is organized- what is the key mapping column allowing to merge the 2 sources :

In 3 simple steps with no technical formula, the same information has been added as in excel with separate tabs and complex LOOKUP formulas.
Additional resources
More about SAP Visual Intelligence
