Have you ever had a chance to see the Smart Meter Analytics (SMA) 1.0 features for customer segmentation? How would you use it in your Utility company? What are some typical queries for finding customer groups you are interested in?
First, you can use any of the master attributes to refine your target group. Here is the whole screen, master data attributes on the left, data visualization on the right. I know, hard to read ... it gets better.

You pick from the available attributes (which you can change in SMA). See how they already show you crucial information how many records they represent, and which power consumption ... all calculated on-the-fly thanks to the power of HANA.

As you select filter values you can check on the right hand side what impact that has on your data. Firstly, there is a chart showing you the distribution of
selected master data attributes (again, you can of course customize these):

Then on the Time Series tab you can see a timeline of the power consumption for the selected customers. It is fun to slide the blue-ish bar at the bottom and extend and shrink the range, effortlessly zooming in and out of the data. There are also a few preset buttons below. The whole thing pretty much works like a stock ticker history gadget.

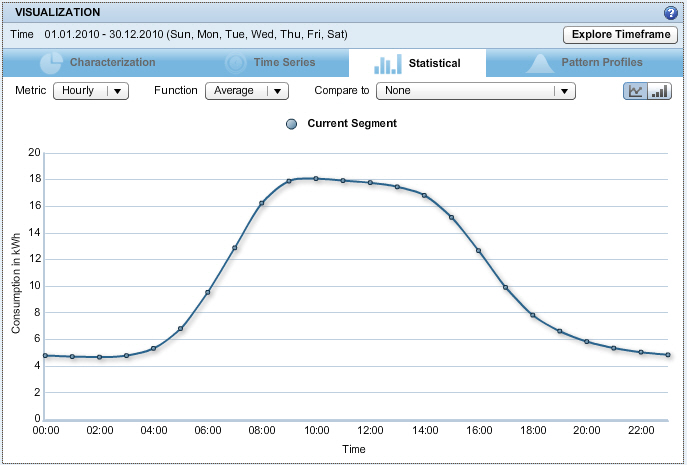
Then on the next tab you can summarize the consumption by hour of the day or day of the week, by averages, totals, minimal or maximum power consumption.
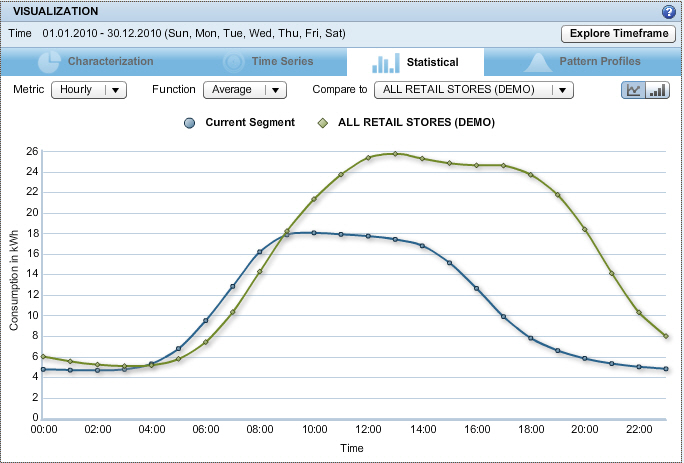
And by the way, on this and the previous tab you can compare what you have so far to other segments as well.
The last tab really has one of the core pieces of SMA, the calculation of so-called pattern profiles. What SMA does when you load smart meter data is to run a nifty algorithm called "k-means clustering" to find out which daily consumption profiles look very similar and should be clustered. Imagine your typical profile as a residential customer. It will have a bump in the morning when everyone gets ready for school and work, then a lull, then another bump in the late afternoon and evening when the family cooks, watches TV, etc. SMA will find those daily patterns which look pretty similar and group them into one pattern profile. Now let's say that many people also work from home twice a week. Your daily profile on those days will be quite different, as you use a computer, run the heating or aircon more intensively, etc. And a third profile may show when the family is on vacation: just a flat line close to zero, which only the fridge and freezer run.
For your current segment SMA shows you which pattern profiles are exhibited in the data, and which are the more prominent ones in terms of overall power consumption and number of days when they showed up. This is an important criterion to select the right target group.

As you filter the data for your desired customers the summary section shows you what you have selected to far, what power consumption this represents, and how many customers you ended up with.

So far we have only filtered customers by their master data. But SMA also allows you to filter by their power consumption. Firstly, you can filter by the aforementioned pattern profiles.

And secondly you can further refine this by how much power your customers will consume. Note that at the top you can also further select that you are only looking at a certain date range, or only certain days of the week.

And then you are pretty much done! Save your new segment, and it will show up in the SMA dashboard, ready for you and colleagues you want to share it with. You could now export the selected customers and use them for a campaign in CRM, just share your insights into customer groups with colleagues, or look at the before and after situation when you have run say an energy efficiency campaign.
So what would you use this for? Where are you in your smart meter rollout?
And there is more cool stuff in SMA, like creating benchmarks on statistical data (do I use more or less energy than my peer group in my neighborhood; how will the energy consumption of my store change if I go from 1500 to 2500 square feet?). Care to see more?
