
- SAP Community
- Products and Technology
- Technology
- Technology Blogs by Members
- On using Data Services for Twitter data sentiment ...
Technology Blogs by Members
Explore a vibrant mix of technical expertise, industry insights, and tech buzz in member blogs covering SAP products, technology, and events. Get in the mix!
Turn on suggestions
Auto-suggest helps you quickly narrow down your search results by suggesting possible matches as you type.
Showing results for
Former Member
Options
- Subscribe to RSS Feed
- Mark as New
- Mark as Read
- Bookmark
- Subscribe
- Printer Friendly Page
- Report Inappropriate Content
07-27-2012
10:27 PM
In this blog I will discuss using Data Services for consumer sentiment analysis of the data collected from Twitter using JSONAdapter.
As discussed in the first blog entry, Twitter Search API has been accessed, with the word ‘cityrail’ as the search term. To those not in the know, Cityrail is the train network of Sydney (Australia) metropolitan area. It was a very obvious target: with relatively big customer base it was guaranteed to get enough unstructured data. Over time (2-3 months) Data Services collected a few thousands tweets supposedly related to Cityrail.
It is worth to elaborate on the data collection process. In one request-response session, Twitter Search API returns up to 100 most recent tweets. Provided that within every 15 minutes the number of tweets about Cityrail does not exceed 100 (that assumption has been confirmed), Data Services Batch Job running every 15 minutes can collect all such tweets almost in real-time.
I would also like to mention a conversation I had with a colleague recently. He wondered if JSONAdapter may help to obtain a large amount of tweets for analysis instantly, and if Twitter Streaming API might help with that. The answer to the last question seems to be negative: once you open a Stream, Twitter feeds entries there in real time, but those are current entries; they can be grouped into time slots or used in another ETL process by Data Services. Streaming API should be used, for example, when for some topic the number of tweets exceeds, say, 100 per minute, hence Batch Job described above may not be able to cope, even if executed every minute.
Otherwise, the only difference between Stream and Search APIs becomes that the Stream API would provide raw data, while Search would apply some extra filtering/ranking by relevance to the search term. In fact, it is possible to build a Data Services job to get historical results, executing consecutive search requests to Search API deeper and deeper into the past (by restricting the TweetID field in a request) -- the process would not be instant, though, but probably running for 1-2 hours (consider it an Initial Load), and it is hard to tell how far into the past it can go.
The bottom line is: if there is an immediate need to analyze the historical data, you may have to contact the Twitter’s partner data providers. Otherwise, JSONAdapter may help to start collecting the data and implement (near) real-time analysis.
The further discussion will be around the following points:
- text parsing using using Data Services,
- ‘noise’ reduction,
- Topic-Sentiment links rebuilding,
- the sarcasm problem (no pun intended!).
Text parsing itself is simpler than one might expect. A special Transform in Data Services v.4.0, called Entity Extraction, parses the input unstructured text and extracts entities and facts about them. Its output is a number or ID’ed records containing one entity/fact each, accompanied with location attributes (paragraph number, sentence number and offset) and categorized accordingly to the rules specified in the Transform options.
Provided out of the box are dictionary of categorized entities and a few rulesets for facts extraction – they are located in the folder TextAnalysis of a standard Data Services installation (availability for use is subject to the license: either full DI+DQ or DI Premium). One of those rulesets, Voice Of Customer (VOC), is used for this work. SAP allows customization of rulesets (at your own risk, of course) and implementation of user-defined dictionaries and rules. SAP has also published several blueprints, which could be used to start new text analyses developments. For this blog, a blueprint for sentiment analysis has been used, it does the following:
- parse the incoming unstructured text into Topic and Sentiment entities using Voice Of Customer ruleset: for example, a phrase “I like apples” would be parsed into Topic=apples and Sentiment=like (accompanied with Sentiment Type ‘StrongPositive’),
- process Topics data and put Topics into groups, to enable some measures, like number of Sentiments per group, and ensure topics like ‘apple’ and ‘apples’ would fall into the same group,
- build a SAP BusinessObjects Universe on top of resulting tables, to enable WebI reporting with slice and dice capabilities.
A few important changes have been made to the blueprint design to deal with Twitter data, the first one covering the issue of noise elimination. For starters, the blueprint assumed the original text to be in plain English; in reality, tweets constitute quite a lingo, full of abbreviations, expletives of all kinds, and with incomplete grammar. In the upcoming SP release for Data Services, SAP makes an attempt to keep in touch with social media and adds new entities for trend/hashtag and for handle/mention. That did not seem enough, and a custom ruleset has been implemented and added to the Entity Extraction transform to detect and mark words that should be excluded from further processing. The picture below demonstrates options of the transform, including two out of the box rulesets followed by the custom one:

This way, if an entity is extracted as both e.g. Topic and a (custom-defined) Blather type of entity, it will be detected in a simple join:

The following screenshot displays a sample output from the transform ‘Blather’, the second column contains the entity extracted from the original tweet and categorized as an expletive:

All such entities would be filtered, thus clearing the output from most of the ‘yucks’, ‘hells’, and ‘lols’. There is one more use of those, which will be discussed a couple paragraphs below.
Noise may also occur on macro-level. Tweets analysis is different from the blueprint in one more way: while the blueprint assumed the source text is completely relevant (for example, customer feedbacks on the imaginary Swiftmobile, collected in a separate folder), tweets don’t have to be. Filtering tweets by a word X returns not just a customer’s view on X, but all aspects of people lives that somehow involve X and that people care to write about. The amount of such macro-noise in ‘cityrail’ selection is, actually, small, but in a selection for, say, ‘westfield’ (a major chain of shopping malls in Australia) it becomes much bigger, for obvious reasons. A possible way to further filter the results would be by having a predefined list of topics specific to the bigger theme.
By default, the output of Entity Extraction transform looks like what might be called a ‘spaghetti’ type of data, i.e. it doesn’t care about relationships between Topics and Sentiments. While it may be considered sufficient, a need to relate Topics and Sentiments may be considered. Assuming that in a sentence related topic and sentiment should be closely located, it’s possible to derive Topic-Sentiment pairs from ParentID and Offset fields of Entity Extraction transform output:

This design obviously ignores topics not accompanied by sentiments and vice versa, and those could be added to the reporting data model.
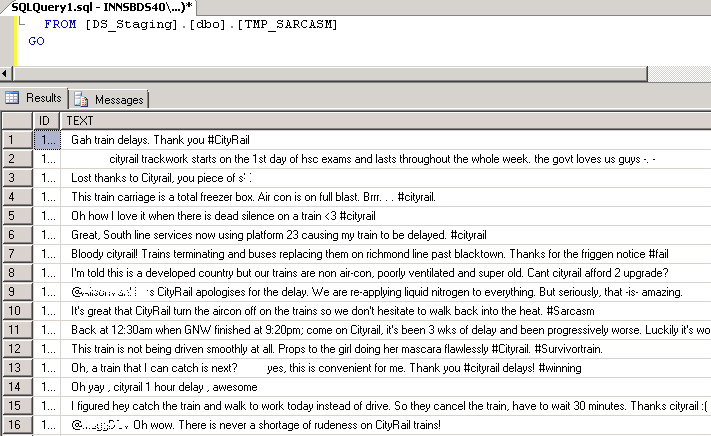
‘Raw’ tweets preview in the database revealed that tweets mostly expressed negative feedback on Cityrail: people tend to complain more often than praise, and – by the way – I wrote the first draft of this blog on the day and hour when some Cityrail’s equipment failure caused major suspension of service and delays. Therefore, it was surprising to see significant ‘StrongPositiveSentiment’-related numbers in the reporting. The reason was that many tweets were sarcastic and should not have been taken literally, but, rather, their sentiment would be opposite to their literal meaning. So, if a tweet is deemed sarcastic, its positive Sentiment should be reverted; while negative Sentiment still counts.
Apparently, sarcasm detection in user feedbacks is a much bigger problem without a general solution. Even a human cannot detect sarcasm perfectly (73% accuracy has been reported from one research), as familiarity with the context is often required. Given the Data Services’ ability to process Python scripts in User Defined Transforms, one might attempt to build a sarcasm detection functionality in Data Services based on a few published approaches, using not only words, but markers of emotions: emoticons, ‘blather’-words discussed above, words highlighting using ‘*’ (like in “I *love* when trains go slowly in rainy weather”) or enclosing into quotation marks, and, of course, the hashtag #sarcasm. Coincidence of negative and positive (rather, strong positive, in terms of VOC’s ruleset) sentiments or, rather, emotions in one tweet is also a potential sarcasm marker. The last one, actually, can be implemented with regular Data Services ETL:

The results below could have been slightly better if VOC knew that ‘con’ is a short form for ‘conditioner’, not a negative sentiment expression. Some extra customization of the dictionary may be required.
Implementation of the full outlined above sarcasm detection functionality scope, however, seems to be a project by its own and beyond this blog.
Setting up reports on the analysed data was not a primary goal of this work, as the SAP blueprint’s approach of BusinessObjects Universe was adopted. The original plan was to use SAP BW BEx reporting, but as storage of texts longer than 60 characters in BW InfoProviders is not trivial, the idea had been discarded.
Consumer sentiment is quantified here by counting the number of feedbacks, restricted measures have been created for each feedback type. The screenshot below demonstrates how Data Quality grouped topics into larger groups using fuzzy matching logic:

A drilldown into a group is then possible, like below:

An extra characteristic, time, has been added to reporting as an obvious choice: there is clear correlation between number of ‘cityrail’ tweets and morning/afternoon transport peak hours. One might think of implementing a “rolling total negative sentiment” of 30 minute scope and raise an alert if that value exceeds some threshold.

Lastly, beyond consumer sentiment analysis, another obvious idea would be to geocode Tweets using either geolocation information (GPS coordinates) from tweets metadata, or geographical names from tweets themselves (post-processing is required for the latter, of course, to eliminate noise). The geocoded data could be made available for visualization in Business Objects or provided to a GIS product like ArcGIS for use in spatial analyses.
- Roman Bukarev
- SAP Managed Tags:
- SAP Data Services
4 Comments
You must be a registered user to add a comment. If you've already registered, sign in. Otherwise, register and sign in.
Labels in this area
-
"automatische backups"
1 -
"regelmäßige sicherung"
1 -
"TypeScript" "Development" "FeedBack"
1 -
505 Technology Updates 53
1 -
ABAP
14 -
ABAP API
1 -
ABAP CDS Views
2 -
ABAP CDS Views - BW Extraction
1 -
ABAP CDS Views - CDC (Change Data Capture)
1 -
ABAP class
2 -
ABAP Cloud
2 -
ABAP Development
5 -
ABAP in Eclipse
1 -
ABAP Platform Trial
1 -
ABAP Programming
2 -
abap technical
1 -
absl
2 -
access data from SAP Datasphere directly from Snowflake
1 -
Access data from SAP datasphere to Qliksense
1 -
Accrual
1 -
action
1 -
adapter modules
1 -
Addon
1 -
Adobe Document Services
1 -
ADS
1 -
ADS Config
1 -
ADS with ABAP
1 -
ADS with Java
1 -
ADT
2 -
Advance Shipping and Receiving
1 -
Advanced Event Mesh
3 -
AEM
1 -
AI
7 -
AI Launchpad
1 -
AI Projects
1 -
AIML
9 -
Alert in Sap analytical cloud
1 -
Amazon S3
1 -
Analytical Dataset
1 -
Analytical Model
1 -
Analytics
1 -
Analyze Workload Data
1 -
annotations
1 -
API
1 -
API and Integration
3 -
API Call
2 -
Application Architecture
1 -
Application Development
5 -
Application Development for SAP HANA Cloud
3 -
Applications and Business Processes (AP)
1 -
Artificial Intelligence
1 -
Artificial Intelligence (AI)
5 -
Artificial Intelligence (AI) 1 Business Trends 363 Business Trends 8 Digital Transformation with Cloud ERP (DT) 1 Event Information 462 Event Information 15 Expert Insights 114 Expert Insights 76 Life at SAP 418 Life at SAP 1 Product Updates 4
1 -
Artificial Intelligence (AI) blockchain Data & Analytics
1 -
Artificial Intelligence (AI) blockchain Data & Analytics Intelligent Enterprise
1 -
Artificial Intelligence (AI) blockchain Data & Analytics Intelligent Enterprise Oil Gas IoT Exploration Production
1 -
Artificial Intelligence (AI) blockchain Data & Analytics Intelligent Enterprise sustainability responsibility esg social compliance cybersecurity risk
1 -
ASE
1 -
ASR
2 -
ASUG
1 -
Attachments
1 -
Authorisations
1 -
Automating Processes
1 -
Automation
2 -
aws
2 -
Azure
1 -
Azure AI Studio
1 -
B2B Integration
1 -
Backorder Processing
1 -
Backup
1 -
Backup and Recovery
1 -
Backup schedule
1 -
BADI_MATERIAL_CHECK error message
1 -
Bank
1 -
BAS
1 -
basis
2 -
Basis Monitoring & Tcodes with Key notes
2 -
Batch Management
1 -
BDC
1 -
Best Practice
1 -
bitcoin
1 -
Blockchain
3 -
bodl
1 -
BOP in aATP
1 -
BOP Segments
1 -
BOP Strategies
1 -
BOP Variant
1 -
BPC
1 -
BPC LIVE
1 -
BTP
12 -
BTP Destination
2 -
Business AI
1 -
Business and IT Integration
1 -
Business application stu
1 -
Business Application Studio
1 -
Business Architecture
1 -
Business Communication Services
1 -
Business Continuity
1 -
Business Data Fabric
3 -
Business Partner
12 -
Business Partner Master Data
10 -
Business Technology Platform
2 -
Business Trends
4 -
CA
1 -
calculation view
1 -
CAP
3 -
Capgemini
1 -
CAPM
1 -
Catalyst for Efficiency: Revolutionizing SAP Integration Suite with Artificial Intelligence (AI) and
1 -
CCMS
2 -
CDQ
12 -
CDS
2 -
Cental Finance
1 -
Certificates
1 -
CFL
1 -
Change Management
1 -
chatbot
1 -
chatgpt
3 -
CL_SALV_TABLE
2 -
Class Runner
1 -
Classrunner
1 -
Cloud ALM Monitoring
1 -
Cloud ALM Operations
1 -
cloud connector
1 -
Cloud Extensibility
1 -
Cloud Foundry
4 -
Cloud Integration
6 -
Cloud Platform Integration
2 -
cloudalm
1 -
communication
1 -
Compensation Information Management
1 -
Compensation Management
1 -
Compliance
1 -
Compound Employee API
1 -
Configuration
1 -
Connectors
1 -
Consolidation Extension for SAP Analytics Cloud
2 -
Control Indicators.
1 -
Controller-Service-Repository pattern
1 -
Conversion
1 -
Cosine similarity
1 -
cryptocurrency
1 -
CSI
1 -
ctms
1 -
Custom chatbot
3 -
Custom Destination Service
1 -
custom fields
1 -
Customer Experience
1 -
Customer Journey
1 -
Customizing
1 -
cyber security
3 -
Data
1 -
Data & Analytics
1 -
Data Aging
1 -
Data Analytics
2 -
Data and Analytics (DA)
1 -
Data Archiving
1 -
Data Back-up
1 -
Data Governance
5 -
Data Integration
2 -
Data Quality
12 -
Data Quality Management
12 -
Data Synchronization
1 -
data transfer
1 -
Data Unleashed
1 -
Data Value
8 -
database tables
1 -
Datasphere
2 -
datenbanksicherung
1 -
dba cockpit
1 -
dbacockpit
1 -
Debugging
2 -
Delimiting Pay Components
1 -
Delta Integrations
1 -
Destination
3 -
Destination Service
1 -
Developer extensibility
1 -
Developing with SAP Integration Suite
1 -
Devops
1 -
digital transformation
1 -
Documentation
1 -
Dot Product
1 -
DQM
1 -
dump database
1 -
dump transaction
1 -
e-Invoice
1 -
E4H Conversion
1 -
Eclipse ADT ABAP Development Tools
2 -
edoc
1 -
edocument
1 -
ELA
1 -
Embedded Consolidation
1 -
Embedding
1 -
Embeddings
1 -
Employee Central
1 -
Employee Central Payroll
1 -
Employee Central Time Off
1 -
Employee Information
1 -
Employee Rehires
1 -
Enable Now
1 -
Enable now manager
1 -
endpoint
1 -
Enhancement Request
1 -
Enterprise Architecture
1 -
ETL Business Analytics with SAP Signavio
1 -
Euclidean distance
1 -
Event Dates
1 -
Event Driven Architecture
1 -
Event Mesh
2 -
Event Reason
1 -
EventBasedIntegration
1 -
EWM
1 -
EWM Outbound configuration
1 -
EWM-TM-Integration
1 -
Existing Event Changes
1 -
Expand
1 -
Expert
2 -
Expert Insights
2 -
Fiori
14 -
Fiori Elements
2 -
Fiori SAPUI5
12 -
Flask
1 -
Full Stack
8 -
Funds Management
1 -
General
1 -
General Splitter
1 -
Generative AI
1 -
Getting Started
1 -
GitHub
8 -
Grants Management
1 -
groovy
1 -
GTP
1 -
HANA
6 -
HANA Cloud
2 -
Hana Cloud Database Integration
2 -
HANA DB
2 -
HANA XS Advanced
1 -
Historical Events
1 -
home labs
1 -
HowTo
1 -
HR Data Management
1 -
html5
8 -
HTML5 Application
1 -
Identity cards validation
1 -
idm
1 -
Implementation
1 -
input parameter
1 -
instant payments
1 -
Integration
3 -
Integration Advisor
1 -
Integration Architecture
1 -
Integration Center
1 -
Integration Suite
1 -
intelligent enterprise
1 -
iot
1 -
Java
1 -
job
1 -
Job Information Changes
1 -
Job-Related Events
1 -
Job_Event_Information
1 -
joule
4 -
Journal Entries
1 -
Just Ask
1 -
Kerberos for ABAP
8 -
Kerberos for JAVA
8 -
KNN
1 -
Launch Wizard
1 -
learning content
2 -
Life at SAP
5 -
lightning
1 -
Linear Regression SAP HANA Cloud
1 -
local tax regulations
1 -
LP
1 -
Machine Learning
2 -
Marketing
1 -
Master Data
3 -
Master Data Management
14 -
Maxdb
2 -
MDG
1 -
MDGM
1 -
MDM
1 -
Message box.
1 -
Messages on RF Device
1 -
Microservices Architecture
1 -
Microsoft Universal Print
1 -
Middleware Solutions
1 -
Migration
5 -
ML Model Development
1 -
Modeling in SAP HANA Cloud
8 -
Monitoring
3 -
MTA
1 -
Multi-Record Scenarios
1 -
Multiple Event Triggers
1 -
Neo
1 -
New Event Creation
1 -
New Feature
1 -
Newcomer
1 -
NodeJS
2 -
ODATA
2 -
OData APIs
1 -
odatav2
1 -
ODATAV4
1 -
ODBC
1 -
ODBC Connection
1 -
Onpremise
1 -
open source
2 -
OpenAI API
1 -
Oracle
1 -
PaPM
1 -
PaPM Dynamic Data Copy through Writer function
1 -
PaPM Remote Call
1 -
PAS-C01
1 -
Pay Component Management
1 -
PGP
1 -
Pickle
1 -
PLANNING ARCHITECTURE
1 -
Popup in Sap analytical cloud
1 -
PostgrSQL
1 -
POSTMAN
1 -
Process Automation
2 -
Product Updates
4 -
PSM
1 -
Public Cloud
1 -
Python
4 -
Qlik
1 -
Qualtrics
1 -
RAP
3 -
RAP BO
2 -
Record Deletion
1 -
Recovery
1 -
recurring payments
1 -
redeply
1 -
Release
1 -
Remote Consumption Model
1 -
Replication Flows
1 -
research
1 -
Resilience
1 -
REST
1 -
REST API
1 -
Retagging Required
1 -
Risk
1 -
Rolling Kernel Switch
1 -
route
1 -
rules
1 -
S4 HANA
1 -
S4 HANA Cloud
1 -
S4 HANA On-Premise
1 -
S4HANA
3 -
S4HANA_OP_2023
2 -
SAC
10 -
SAC PLANNING
9 -
SAP
4 -
SAP ABAP
1 -
SAP Advanced Event Mesh
1 -
SAP AI Core
8 -
SAP AI Launchpad
8 -
SAP Analytic Cloud Compass
1 -
Sap Analytical Cloud
1 -
SAP Analytics Cloud
4 -
SAP Analytics Cloud for Consolidation
3 -
SAP Analytics Cloud Story
1 -
SAP analytics clouds
1 -
SAP BAS
1 -
SAP Basis
6 -
SAP BODS
1 -
SAP BODS certification.
1 -
SAP BTP
21 -
SAP BTP Build Work Zone
2 -
SAP BTP Cloud Foundry
6 -
SAP BTP Costing
1 -
SAP BTP CTMS
1 -
SAP BTP Innovation
1 -
SAP BTP Migration Tool
1 -
SAP BTP SDK IOS
1 -
SAP Build
11 -
SAP Build App
1 -
SAP Build apps
1 -
SAP Build CodeJam
1 -
SAP Build Process Automation
3 -
SAP Build work zone
10 -
SAP Business Objects Platform
1 -
SAP Business Technology
2 -
SAP Business Technology Platform (XP)
1 -
sap bw
1 -
SAP CAP
2 -
SAP CDC
1 -
SAP CDP
1 -
SAP CDS VIEW
1 -
SAP Certification
1 -
SAP Cloud ALM
4 -
SAP Cloud Application Programming Model
1 -
SAP Cloud Integration for Data Services
1 -
SAP cloud platform
8 -
SAP Companion
1 -
SAP CPI
3 -
SAP CPI (Cloud Platform Integration)
2 -
SAP CPI Discover tab
1 -
sap credential store
1 -
SAP Customer Data Cloud
1 -
SAP Customer Data Platform
1 -
SAP Data Intelligence
1 -
SAP Data Migration in Retail Industry
1 -
SAP Data Services
1 -
SAP DATABASE
1 -
SAP Dataspher to Non SAP BI tools
1 -
SAP Datasphere
10 -
SAP DRC
1 -
SAP EWM
1 -
SAP Fiori
2 -
SAP Fiori App Embedding
1 -
Sap Fiori Extension Project Using BAS
1 -
SAP GRC
1 -
SAP HANA
1 -
SAP HCM (Human Capital Management)
1 -
SAP HR Solutions
1 -
SAP IDM
1 -
SAP Integration Suite
9 -
SAP Integrations
4 -
SAP iRPA
2 -
SAP Learning Class
1 -
SAP Learning Hub
1 -
SAP Odata
2 -
SAP on Azure
1 -
SAP PartnerEdge
1 -
sap partners
1 -
SAP Password Reset
1 -
SAP PO Migration
1 -
SAP Prepackaged Content
1 -
SAP Process Automation
2 -
SAP Process Integration
2 -
SAP Process Orchestration
1 -
SAP S4HANA
2 -
SAP S4HANA Cloud
1 -
SAP S4HANA Cloud for Finance
1 -
SAP S4HANA Cloud private edition
1 -
SAP Sandbox
1 -
SAP STMS
1 -
SAP successfactors
3 -
SAP SuccessFactors HXM Core
1 -
SAP Time
1 -
SAP TM
2 -
SAP Trading Partner Management
1 -
SAP UI5
1 -
SAP Upgrade
1 -
SAP Utilities
1 -
SAP-GUI
8 -
SAP_COM_0276
1 -
SAPBTP
1 -
SAPCPI
1 -
SAPEWM
1 -
sapmentors
1 -
saponaws
2 -
SAPS4HANA
1 -
SAPUI5
4 -
schedule
1 -
Secure Login Client Setup
8 -
security
9 -
Selenium Testing
1 -
SEN
1 -
SEN Manager
1 -
service
1 -
SET_CELL_TYPE
1 -
SET_CELL_TYPE_COLUMN
1 -
SFTP scenario
2 -
Simplex
1 -
Single Sign On
8 -
Singlesource
1 -
SKLearn
1 -
soap
1 -
Software Development
1 -
SOLMAN
1 -
solman 7.2
2 -
Solution Manager
3 -
sp_dumpdb
1 -
sp_dumptrans
1 -
SQL
1 -
sql script
1 -
SSL
8 -
SSO
8 -
Substring function
1 -
SuccessFactors
1 -
SuccessFactors Platform
1 -
SuccessFactors Time Tracking
1 -
Sybase
1 -
system copy method
1 -
System owner
1 -
Table splitting
1 -
Tax Integration
1 -
Technical article
1 -
Technical articles
1 -
Technology Updates
14 -
Technology Updates
1 -
Technology_Updates
1 -
terraform
1 -
Threats
1 -
Time Collectors
1 -
Time Off
2 -
Time Sheet
1 -
Time Sheet SAP SuccessFactors Time Tracking
1 -
Tips and tricks
2 -
toggle button
1 -
Tools
1 -
Trainings & Certifications
1 -
Transport in SAP BODS
1 -
Transport Management
1 -
TypeScript
2 -
ui designer
1 -
unbind
1 -
Unified Customer Profile
1 -
UPB
1 -
Use of Parameters for Data Copy in PaPM
1 -
User Unlock
1 -
VA02
1 -
Validations
1 -
Vector Database
2 -
Vector Engine
1 -
Visual Studio Code
1 -
VSCode
1 -
Web SDK
1 -
work zone
1 -
workload
1 -
xsa
1 -
XSA Refresh
1
- « Previous
- Next »
Related Content
- SAP Signavio is the highest ranked Leader in the SPARK Matrix™ Digital Twin of an Organization (DTO) in Technology Blogs by SAP
- ABAP Cloud Developer Trial 2022 Available Now in Technology Blogs by SAP
- SAP Partners unleash Business AI potential at global Hack2Build in Technology Blogs by SAP
- Unify your process and task mining insights: How SAP UEM by Knoa integrates with SAP Signavio in Technology Blogs by SAP
- SAP HANA Cloud Vector Engine: Quick FAQ Reference in Technology Blogs by SAP
Top kudoed authors
| User | Count |
|---|---|
| 8 | |
| 5 | |
| 5 | |
| 4 | |
| 4 | |
| 3 | |
| 3 | |
| 3 | |
| 3 | |
| 3 |