
- SAP Community
- Products and Technology
- Financial Management
- Financial Management Blogs by Members
- How to build Rolling Forecasts in BPC 10.0
Financial Management Blogs by Members
Dive into a treasure trove of SAP financial management wisdom shared by a vibrant community of bloggers. Submit a blog post of your own to share knowledge.
Turn on suggestions
Auto-suggest helps you quickly narrow down your search results by suggesting possible matches as you type.
Showing results for
srikanth_gandlu
Explorer
Options
- Subscribe to RSS Feed
- Mark as New
- Mark as Read
- Bookmark
- Subscribe
- Printer Friendly Page
- Report Inappropriate Content
07-22-2012
1:52 PM
Applicable Releases:
SAP BusinessObjects Planning and Consolidation 10.0
Table of Contents
- Background Information
- Prerequisites
- Step-by-Step Procedure
3.1 Yearly Forecast Template
3.2 Periodic Forecast Template
3.3 An Alternate Method to Periodic Rolling Forecast
4. Conclusion
1. Background Information
In the present day, with business conditions being volatile and uncertain, several businesses have begun to adopt forecasting techniques that help make projections of likely future outcomes. While businesses aim for a static outlook of the future, there are ones that would like a more dynamic view. One commonly used practice to get a dynamic view is by creating some Rolling Forecasts. Rolling forecasts typically have a fixed number of time periods, such as 12 periods. Let’s say we have a forecast from March to February. As time progresses the actuals become available for the current period and by the end of the period, i.e., February, it moves from being a future prediction to the current reality. This period hence drops off from the forecast schedule and another period, i.e., March of the following year, is added to the end of the forecast, maintaining the number of periods being viewed, constant.
Some businesses would like to fix the number of periods in the forecast to years. In this document you will find a few ways of creating such Rolling Forecast Input Forms/Reports, both Periodic and Yearly. The reports have been built using a combination of Excel based and EPM based formulae.
2. Prerequisites
The first steps after you have logged in and launched the EPM Office Add-in Excel, is to ensure that you have removed the setting to “Activate Member Recognition” in the General tab of the EPM – Sheet Options (Figure 1).

Figure 1
3. Step-by-Step Procedure
3.1 Yearly Forecast Template
Let’s take a scenario where we would like to see a combination of Actual, Plan and Forecast values. Assume current year as 2012. We will try to build a report that will have 2011.TOTAL showing ‘Actual’ data, 2012.TOTAL with ‘Plan’ data and the next four - 2013.TOTAL to 2017.TOTAL, showing ‘Forecast’ data.
We first build a report as below (Figure 2)

Figure 2
The next step is to set the current year in the cell D1 of the Sheet (Figure 3). We use a common Excel based formula to derive this. [=CONCATENATE(YEAR(TODAY()),”.”,”TOTAL”)].
NOTE: The figures would show formulae that have ‘;’ used in them. I use an Excel version (and key-pad) that is customized to Scandinavian laptops. I have therefore written the formulae again (in the running text) along with the figures – but without the ‘;’ and have used ‘,’ instead – as is the common practice. I did this, so you can copy the formula directly from this paper when you try it on your machines.

Figure 3
In the cell E1, enter an EPM formula as an offset with ‘+1’ with the current year that we derived in cell D1. The formula is [=EPMMemberOffset(,D1,1)]. (Figure 4)

Figure 4
Now fill handle cell E1 and drag until cell I1. (Figure 5)

Figure 5
To get the previous (Year-1), use the formula as shown in figure below [=EPMMemberOffset(,D1,-1)]. (Figure 6)

Figure 6
The next step is to get the Categories in the second row. We use a basic Excel formula to achieve this. Use formula[=IF(LEFT(YEAR(TODAY()),4)=LEFT(D1,4),"PLAN",IF(LEFT(YEAR(TODAY()),4)<LEFT(D1,4),"FORECAST","ACTUAL"))] to derive the ‘PLAN’ member, in cell D2. (Figure 7)

Figure 7
Fill handle drag the cell D2 to cell C2, to derive the ‘ACTUAL’ for '2011.TOTAL'. Do the same for cells E2 to I2. (Figure 8)

Figure 8
Now select the member 2011.TOTAL in the actual report, i.e., cell C10 and insert the reference to the cell C1 that we just created. (Figure 9)

Figure 9
This means that we substitute the formula [=EPMOlapMemberO("[TIME].[PARENTH1].[2011.TOTAL]","","2011.TOTAL","","000")] with [=EPMOlapMemberO(C1,"[TIME].[PARENTH1].[2011.TOTAL]","2011.TOTAL","","000")]. (Figure 10)
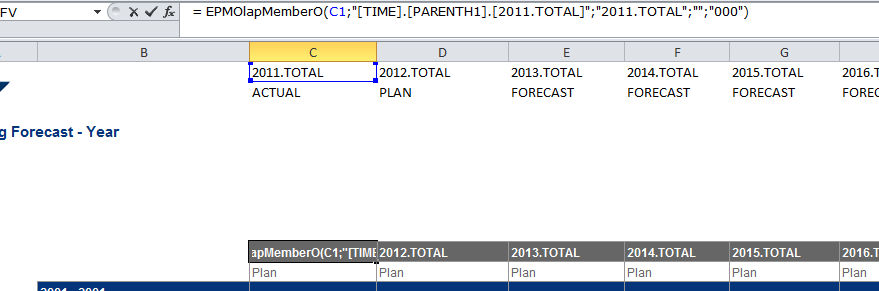
Figure 10
Fill handle drag the cells C10 to I10. (Figure 11)
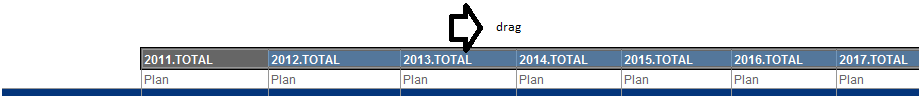
Figure 11
Do this now for the Category dimension member in cell C11. Substitute the formula [=EPMOlapMemberO("[CATEGORY].[].[PLAN]","","Plan","","000")] with formula [=EPMOlapMemberO(C2,"[CATEGORY].[].[PLAN]","Plan","","000")]. (Figure 12)

Figure 12
Fill handle drag the Category members too as shown in the figure 13 below.

Figure 13
This report should now look like this. The rows 1 and 2 can of course be hidden to make the report look cleaner. (Figure 14)

Figure 14
3.2 Periodic Forecast Template
The second report shown here is to create a report for a periodic forecast. The steps are similar to the one shown for the yearly template. Here’s how it’s built.
Select the cell C1 and enter formula an Excel formula to derive the current period. The formula appears more complicated than what it in fact really does. The reason is that, with basic Excel formulae we can derive a value for a period such as 2012.6, which isn’t supported by BPC. To convert it to the BPC recognized format we insert a ‘0’ to make it 2012.06. We assume that the current period is June 2012 (2012.06). (Figure 15)
Formula: [=CONCATENATE(YEAR(TODAY()),".";IF(MONTH(TODAY())=1,"0",IF(MONTH(TODAY())=2,"0",IF(MONTH(TODAY())=3,"0",IF(MONTH(TODAY())=4,"0",IF(MONTH(TODAY())=5,"0",IF(MONTH(TODAY())=6,"0",IF(MONTH(TODAY())=7,"0",IF(MONTH(TODAY())=8,"0",IF(MONTH(TODAY())=9,"0",))))))))),MONTH(TODAY()))]
Formula: [=CONCATENATE(YEAR(TODAY()),".";IF(MONTH(TODAY())=1,"0",IF(MONTH(TODAY())=2,"0",IF(MONTH(TODAY())=3,"0",IF(MONTH(TODAY())=4,"0",IF(MONTH(TODAY())=5,"0",IF(MONTH(TODAY())=6,"0",IF(MONTH(TODAY())=7,"0",IF(MONTH(TODAY())=8,"0",IF(MONTH(TODAY())=9,"0",))))))))),MONTH(TODAY()))]

Figure 15
The month 2012.06 is derived. In the cell D2 write an EPMMemberOffset formula to offset the value of C1 by a ‘+1’.
Fill drag the cells until cell N1. (Figure 16)

Figure 16
Now to derive the Category member using another Excel formula, given below.
[=IF(C1=(CONCATENATE(YEAR(TODAY()),".",IF(MONTH(TODAY())=1,"0",IF(MONTH(TODAY())=2,"0",IF(MONTH(TODAY())=3,"0",IF(MONTH(TODAY())=4,"0",IF(MONTH(TODAY())=5,"0",IF(MONTH(TODAY())=6,"0",IF(MONTH(TODAY())=7,"0",IF(MONTH(TODAY())=8,"0",IF(MONTH(TODAY())=9,"0",))))))))),MONTH(TODAY()))),"ACTUAL","FORECAST")]. Drag fill the Category cell C2 until cell N2. (Figures 17 & 18)

Figure 17

Figure 18
Change the references to the cells in the actual report, i.e., cell C7 for the Period dimension member pointing to cell C1. This means you substitute formula in C7 as [= EPMOlapMemberO(C1,"[TIME].[PARENTH1].[2012.01]","2012.01","","000")]. Do the same in cell C8, for the Category dimension and reference it to the cell C2 that we just derived using an Excel formula. (Figure 19)

Figure 19

Figure 20
When you have changed the references to the cells now to C1 and C2, drag fill the cells C7 to N7 for Periods and C8 to N8 for the Category dimension. Your report should now look like the one below. (Figure 21)

Figure 21
3.3 An Alternate Method to Periodic Rolling Forecast
There is another method that you can use too. This method allows you more flexibility in terms of the ability to choose and change the time period. For example instead of just viewing a static report that shows only from the current period to a fixed number of periods to the future, you can allow the possibility for the user to change the first period in the fixed number of periods. For e.g. if the user decides to view the values of a previous period, let’s say 2012.05 (assuming that current period is 2012.06) and not just the current period 2012.06, he should be able to do so. We can create a report of this nature as illustrated below.
In the cell B1 insert Excel formula [=EPMContextMember(,TIME)]. This will derive the time member from the EPM context. In this case it returned value 2012.TOTAL. (Figure 22)
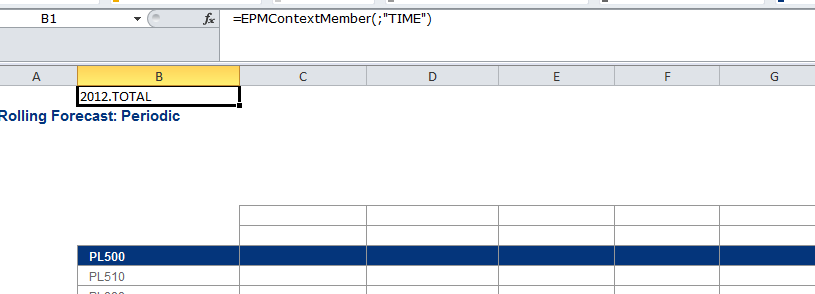
Figure 22
In the cell C1 insert an Excel formula referencing the cell B1. This formula is employed to derive the periods – If the property of the member is ‘YEAR’ it derives the first period of the year and if it’s the Quarters it picks the first period of the corresponding quarter, for e.g. it would pick 07 for Q3.
Formula: [=IF(EPMMemberProperty(,B1,"LEVEL")="YEAR",LEFT(B1,4)&".01",IF(RIGHT(B1,2)="Q1",LEFT(B1,4)&".01",IF(RIGHT(B1,2)="Q2",LEFT(B1,4)&".03",IF(RIGHT(B1,2)="Q3",LEFT(B1,4)&".07",IF(RIGHT(B1,2)="Q4",LEFT(B1,4)&".10",B1)))))] (Figure 23)

Figure 23
It has derived the value 2012.01 as I have 2012.TOTAL in my EPM context. Create an EPMMemberOffset formula in cell D1, offsetting the value in C1 with a ‘+1’. Now drag fill the formula until N1 or the cell desired. (Figure 24)

Figure 24
Use formula below to derive the member value of the Category dimension, in the cell C2. We have used this formula to get PLAN data for the current period, ACTUAL data for the prior periods and FORECAST data for all future periods.
Formula:
[=IF(((CONCATENATE(YEAR(TODAY()),".",IF(MONTH(TODAY())=1,"0",IF(MONTH(TODAY())=2,"0",IF(MONTH(TODAY())=3,"0",IF(MONTH(TODAY())=4,"0",IF(MONTH(TODAY())=5,"0",IF(MONTH(TODAY())=6,"0",IF(MONTH(TODAY())=7,"0",IF(MONTH(TODAY())=8,"0",IF(MONTH(TODAY())=9,"0",))))))))),MONTH(TODAY())))=C1),"PLAN",IF((CONCATENATE(YEAR(TODAY()),".",IF(MONTH(TODAY())=1,"0",IF(MONTH(TODAY())=2,"0",IF(MONTH(TODAY())=3,"0",IF(MONTH(TODAY())=4,"0",IF(MONTH(TODAY())=5,"0",IF(MONTH(TODAY())=6,"0",IF(MONTH(TODAY())=7,"0",IF(MONTH(TODAY())=8,"0",IF(MONTH(TODAY())=9,"0",))))))))),MONTH(TODAY())))<C1,"FORECAST","ACTUAL"))] (Figure 25)
[=IF(((CONCATENATE(YEAR(TODAY()),".",IF(MONTH(TODAY())=1,"0",IF(MONTH(TODAY())=2,"0",IF(MONTH(TODAY())=3,"0",IF(MONTH(TODAY())=4,"0",IF(MONTH(TODAY())=5,"0",IF(MONTH(TODAY())=6,"0",IF(MONTH(TODAY())=7,"0",IF(MONTH(TODAY())=8,"0",IF(MONTH(TODAY())=9,"0",))))))))),MONTH(TODAY())))=C1),"PLAN",IF((CONCATENATE(YEAR(TODAY()),".",IF(MONTH(TODAY())=1,"0",IF(MONTH(TODAY())=2,"0",IF(MONTH(TODAY())=3,"0",IF(MONTH(TODAY())=4,"0",IF(MONTH(TODAY())=5,"0",IF(MONTH(TODAY())=6,"0",IF(MONTH(TODAY())=7,"0",IF(MONTH(TODAY())=8,"0",IF(MONTH(TODAY())=9,"0",))))))))),MONTH(TODAY())))<C1,"FORECAST","ACTUAL"))] (Figure 25)

Figure 25
Drag fill the Category dimension too to complete the members until N2. As you can see below the report shows PLAN for 2012.06, ACTUAL for 2012.01 to 2012.05, and FORECAST for 2012.07 to 2012.12. (Figure 26)
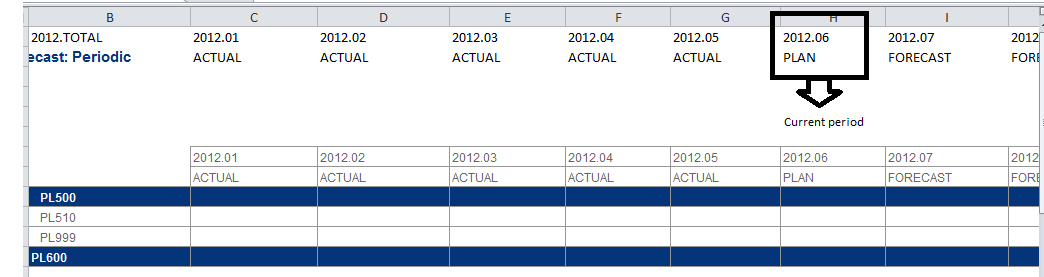
Figure 26
The part that makes this report a bit more dynamic is the possibility to change the value in cell B1 by double clicking on it, and changing the value from the window that pops up for the TIME dimension OR by just changing the value on the Context Pane. (Figure 27)

Figure 27
If you notice we have changed the TIME member to 2012.05 and the report now begins with 2012.05. (Figure 28)

Figure 28
4. Conclusion
There are several ways in which rolling forecasts can be built. This is only one approach at doing it. These reports above have been created on the BPC 10.0 NW (sp06). This hasn’t been tested on the MS version but it might as well work on that version too, since the development is based on the EPM Office Add-in Excel and involves no settings on the backed server.
A good approach would be to have the setting for auto refresh of the workbook when it’s started. This would ensure that the current time period is refreshed and the report is adjusted accordingly.
- SAP Managed Tags:
- SAP Business Planning and Consolidation, version for SAP NetWeaver
10 Comments
You must be a registered user to add a comment. If you've already registered, sign in. Otherwise, register and sign in.
Labels in this area
-
Assign Missing Authorization Objects
1 -
Bank Reconciliation Accounts
1 -
CLM
1 -
FIN-CS
1 -
Finance
2 -
GRIR
1 -
Group Reporting
1 -
Invoice Printing Lock
2 -
Mapping of Catalog & Group
1 -
Mapping with User Profile
1 -
matching concept and accounting treatment
1 -
Oil & Gas
1 -
Payment Batch Configurations
1 -
Public Cloud
1 -
Revenue Recognition
1 -
review booklet
1 -
SAP BRIM
1 -
SAP CI
1 -
SAP RAR
1 -
SAP S4HANA Cloud
1 -
SAP S4HANA Cloud for Finance
1 -
SAP Treasury Hedge Accounting
1 -
Z Catalog
1 -
Z Group
1
Related Content
- Rolling forecast sap analytic cloud in Financial Management Q&A
- GRC Tuesdays: All I Want for Christmas is Cyber Safety in Financial Management Blogs by SAP
- Rolling forecast In Sap BPC Embedded (Using PAK or IP or Fox Logic) in Financial Management Q&A
- Leading Digital Innovations and Economic Models in Financial Management Blogs by Members
- Demystifying S4HANA Group Reporting in Financial Management Blogs by SAP