SAP's Steve Lucas started a session in the Database & Technology theatre at the SAPPHIRE NOW show floor with the words: ‘I will use another 100 times the word HANA today’. And indeed SAP HANA was THE buzzword during SAPPHIRE NOW 2012. But between the HANA demos, HANA scale-out solutions, HANA business cases and HANA #likeneverbefore booths you could see a lot of great, new and great new products and solutions.
We had well balanced discussions about BW on HANA, BPC on HANA, ERP on HANA, mobile apps and SAP Visual Intelligence at the SAP Runs SAP
booth. Especially on the last day – after the product announcement in the keynotes - SAP Visual Intelligence became the hot topic.
At that day you had a chance to see a product demo at some booths, but David Poisson and I had the chance to show the tool with a real use case on real data – not a fictive company story. We told the SAP Runs SAP story and this was well received.

Picture: SAP Visual Intelligence demos for Gerd Oswald and Jim Hagemann Snabe
What is SAP Visual Intelligence? My answer in a nutshell:
- It is the latest innovation in the SAP BusinessObjects Explorer software family.
- It’s desktop-based.
- It’s great for data manipulation and visualization.
- It connects to HANA cube in the first version, but connectors to a variety of corporate and personal data sources will follow soon.
- It is designed for business users and analysts to get information without any scripting.
So let’s get started with our scenario: User statistics from the SAP Community Network. (Disclaimer: Pictures below are illustrative and does not show business data)
For this analytics scenario the SCN team and the SAP Global IT BI team partnered. The user statistics are available in SAP HANA. SAP Visual Intelligence client is installed locally on your desktop/laptop using the 64bit hardware architecture, the full CPU power and the increased RAM to process big data sets.
When you start SAP Visual Intelligence and click on ‘New Document’ then only one type of connection to HANA is available. In the employee area of the SAP internal Corporate Portal the link to SAP BusinessObjects Explorer with Excel/CSV upload possibility is still in the top 10 usage. Of course we wish to move our business users to platform based analytics on single-point-of-truth data, but there is a high need to manipulate and visualize offline data sets and SAP Visual Intelligence will have these connectors in the near future as well. With that it will become a powerful tool for offline usage during train or flight travel.

Picture: SAP Visual Intelligence start screen
Once the data is loaded you can easily drag and drop (red arrows) your measures, hierarchies and attributes into the visualization window. In the example below we simply want to understand see the number of users per year.
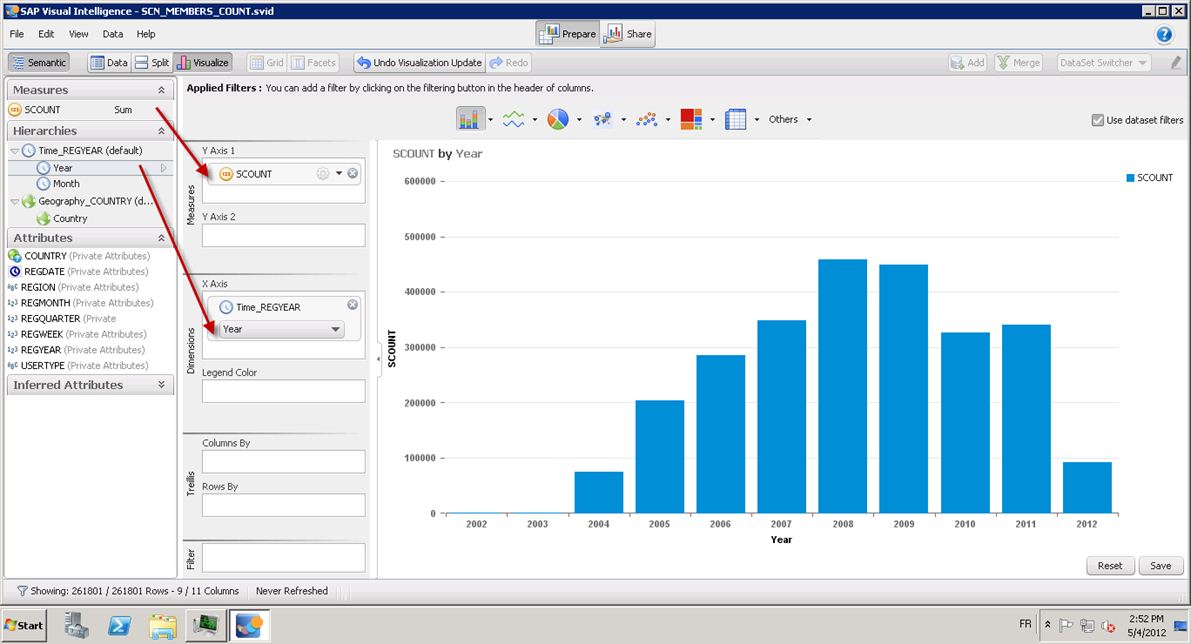
Picture: Column bar chart based on user count and year
Very powerful in SAP Visual Intelligence is the geographic intelligence. Available city information can be extended by country and region. Pie charts on maps can combine magnitude and classification. In the example below we show the distribution of SCN users by country and the split in user type.

Picture: Map view with pie charts per country
Special thanks to the SAP Global IT BI team in Paris for the preparation of this use case and the screen shots!
Run the video below and imagine the fun to sort, manipulate, visualize and share data with SAP Visual Intelligence. I love it already!
Recent information sources for SAP Visual Intelligence:
Best regards,
Matthias Wild - proud to be part of SAP Global IT where SAP runs SAP.
