- SAP Community
- Products and Technology
- Additional Blogs by Members
- KPI derivation with Data-classification - A DataMo...
- Subscribe to RSS Feed
- Mark as New
- Mark as Read
- Bookmark
- Subscribe
- Printer Friendly Page
- Report Inappropriate Content
Prerequisite to the Readers:
Basic BW knowledge is required.
Applies to:
All the releases of BW.
Summary:
This paper gives a detail understanding of deriving the complex KPI with the data classification technique.
Solution was implemented and tested in BW7.0, and applicable for all the releases and went Live.
1. Introduction
Generally BW reports are built to report Facts classified as Measures, Performance Indicators (PI), Key Performance Indicators (KPI) and Metrics.
Measures: A measured value that is usually calculated from the quantities and values contained within a transaction or a count derived from one or more dimensions.
Example: Employee Count, Customer Count, Sales Value etc.,
Performance Indicator: Measurements of an activity related to a company’s business performance. This will combine at least two different Measures
Example: Actual Value v Budget Value, and may include benchmarking against historical values, Profitability of the Top 10% of Customers etc.,
Key Performance Indicator: Measurement of something that is important to the business, directly linked to a strategic objective or target. This will combine at least two different Measures and/or PI’s. These will be chosen by senior management to monitor the success/failure of the company’s business priorities.
Example: Orders delivery on time, Aging etc.,
Metrics: Sum of Measures, PIs & KPIs
2. Objective
As explained in the previous section, KPIs are constructed combining business critical cases and conditions.
The main objective of this document is to design a KPI with data classification business cases. To calculate each data classification case, need to consider corresponding Sales document types, and it’s associated all the Item categories.
For example, To achieve the Sales volume KPI, need to consider multiple business cases, it’s associated multiple Sales document types and it’s associated all Item categories.
Challenge is that to handle multiple restrictions about more than a hundred, and we cannot maintain such a restriction directly in the query, which may hamper query performance.
It is explained more detailed in further sections.
The one which will be discussed now is related to the functional area ‘Sales’. However, the process is a generic and can be applied to any functional area without any limitations.
2.1. Requirement:
The requirement is to design the KPI ‘XYZB1’ sales volume.
Design of this KPI requires to add and subtract the keyfigure based on the Business Data Classification cases. ‘X+’ indicates addition and ‘X-’ indicates subtraction.
Data classification cases for addition(X+):
Sales Finish Good
Sales Finish Good Executed
Promotions And Bonifications
Data classification cases for subtraction(X-):
Return Finish Good
Return Free Goods
Return Promotions And Bonifications
Return Internal Consumption
Each Business Data Classification case and its relation with sales document type and its associated item categories are given in the following screen.
Screen1:
 S
S
We need to consider many Business data classification cases to derive sales volume, but only few are considered/displayed in this document to illustrate the solution.
To calculate each data classification case, need to consider corresponding Sales document types, and its associated all the Item categories.
Please refer to the Screen 1, For example to get the case ‘Sales Finish Good’, we need to consider Sales document type ‘YDOR’ and its associated all Item categories ‘YG01’,’YG02’ and ‘ZG02’.
In this way, we need to consider and add all the cases related to ‘X+’ and ‘X-‘ separately, and subtract ‘X-‘ values from ‘X+’.
3. Implementation
As the relation between Sales document type and Item category is ‘1:N’, We did implemented with a technique which simplified the design and eliminated the ‘ABAP’ code and explained step by step in the following sections.
3.1. Step by Step Procedure
a. Create a Infoobject named ‘Data classification’ (ZSADATCLS) to hold all the Data classification cases. Load this data by creating a text data load flow as shown in the following screen shots.
Screen2:

Screen3:

The flat file text load structure is given in the next diagram. These Data classification cases are with reference to the requirement given in Screen 1.
Screen4:

a. b. Create a Infoobject ‘Doctype/Item Category’ (Char with Length ‘8’) and Maintain ‘Data Classification’ Infoobject as Navigational attribute.
Screen5:

Screen6:

In the transformation use formula to concatenate Doc type and Item category as shown in Screen 8.
Screen7:

Screen8:

The flat file structure of the data load will look like as shown below.
Screen9:

After the load the data looks like as per the screen following.
Screen10:

c. In the transformation which was created as part of the transaction data flow to the sales cube(Standard sales datasource connected to the Sales cube with transformation, this is not explained in this document), Infobject ‘ZSADTIC’ needs to be included and formula to be maintained to concatenate Sales document type and item category.
And normal transaction data load needs to be performed.
Screen11:

Formula used is shown below.
Screen12:

d. Create a Multiprovider for reporting on the sales cube(optional, as reporting can even be made on Cube), Maintain the identification as given in the following screen.
Screen13:

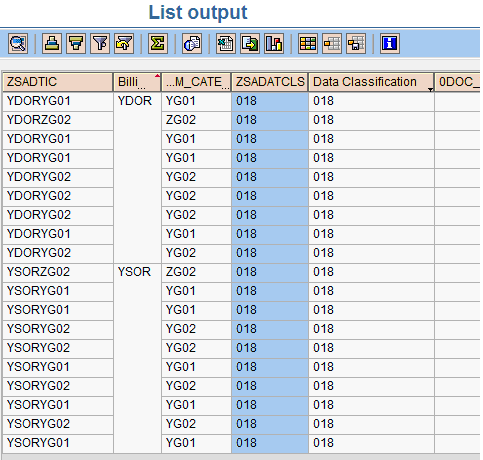
Multiprovider output will display as given below. And from this, it is evident that if we restrict on ‘Dataclassification’ with the ‘018’ in the report, we will get the ‘Sales finish Good’ related data considering all the sales document types and its associated item categories.
Screen14:

e. Report needs to be created and The restriction in the query for the ‘X+’ and 'X-' business Data classification cases are to be considered separately for addition and to be subtracted one from another, as shown in the screens from 15 to 18.
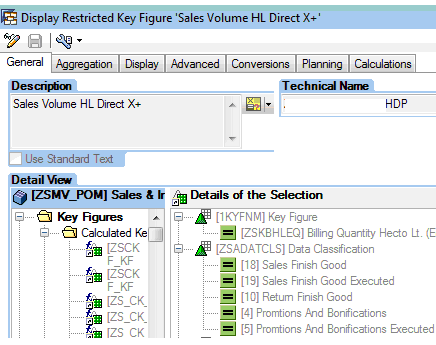
The following is the Restricted keyfigure created with 'X+' cases.
Screen15:

The following is the Restricted keyfigure created with 'X-' cases.
Screen16:

The following is the Caluculated keyfigure created with the formula ('X+') + ('X-').
Screen17:

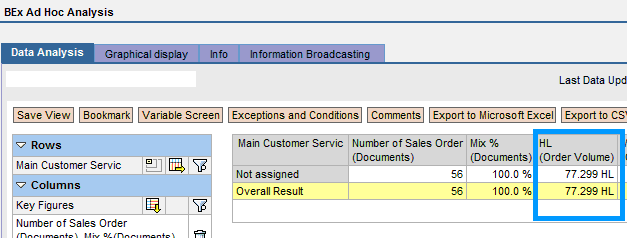
Query Output is shown below.
Screen18:

4. Advantages
- Whenever business adds a new Data classification case, we can handle just by loading flat file to the Infoobjects.
- Query performance is improved, as most of the restrictions are done in the database (back end).
5. Alternatives
All the sales document types and Item categories related to all the business cases (all the flat file entries, around more than hundred) needs to be used in the restriction of the volume Keyfigure, this will hamper the Query performance.