In the future Businesses will make decisions with BPM & HANA - Part 1 of this blog series I talked about how decisions would be made using a combination of technologies especially BPM and HANA. NBA ( Next Best Action ) is the key in managing customers as enterprises needs to have an intelligent DNA in them to decide in few seconds what would be the best action possible given a particular customer context.
Hadoop for processing unstructured data.
Apache Hadoop is an implementation of Google's papers on MapReduce and GFS.It is extremely good at processing huge amount of mostly unstructured data type in a distributed fashion. Hadoop is not a real time system like HANA, it's a batch processing system, meaning you submit jobs to it which it will distribute using it's HDFS distributed file system and perform Map and Reduce operations on top of data. Hadoop does not intend to compete with RDBMS, instead it complements it in the areas of batch processing on huge amounts of unstructured data which is again fed back to RDBMS for real processing and analytics.
Setting up Hadoop would require a separate blog on its own, which I'm planning to write in the near future. I will present here the MapReduce programs and analytics that I did using Hadoop. The result of this processing would be fed into HANA for real time NBA determination in BPM.
Unstructured Data.
Unstructured data is basically data without schema which cannot in its raw form can be analyzed. Lately unstuctured data has been growing at exponential rates in the enterprise as more and more systems comes online and enterprises wants to capture as much data as possible to make the best decisions in a matter of second.
I would be using a sample data from an ecommerce application logs in which customer logs and performs various actions. Here a snapshot of the data I generated for processing with Hadoop.

Once you have your data you can start writing Map Reduce programs to start processing this data. I wrote several programs to analyze activities, referrals, purchase amount by location, most browsed product models and grouped them by location to produce visualization of each.
Map Reduce programs were written in Python using Hadoop streaming API. One of the advantage with this approach is that I can even simulate Hadoop programs before I submit them for correctness and testing, which saved me from lots of trouble.
Map Program
import sys
hadoopsimulation = int(sys.argv[1])
index = int( sys.argv[2])
arr = []
for line in sys.stdin:
if hadoopsimulation:
import operator
a = line.strip().split(",")
arr.append(a)
arr = sorted( arr, key=operator.itemgetter(1))
elif line.strip().split(",")[index].isdigit():
print line.strip().split(",")[index] +" "+line
if hadoopsimulation:
for a in arr:
output = ""
for i in a:
output += i+","
print a[1]," ",output
The above program check whether Hadoop simulation is set to True, it then produces sorted keys for customer id attribute with the entire line ( Not a good practice, only a small subset of data should be emitted as value ).
Note : this approach is not scalable for huge amount of data, so use cut command to sample out small data for testing purpose while using Hadoop simulation.
Reduce Program
import sys
avg = 0.0
last_key = None
sum = 0.0
total_count = 0
total_purchase_count = 0
logintime,logouttime,loggedintime = 0,0,0
suc_closed,fail_closed,suc_withdrawn,suc_pending,not_closed = 0,0,0,0,0
referrals = 0
p_senti = ["great","outstanding","impressive","wow","brilliant"]
n_senti = ["not","pointless","crap"]
p_count,n_count=0,0
sep = ","
for line in sys.stdin:
if len ( line.strip().split(" ") ) > 1:
fields = line.strip().split(" ")[1].split(",")
(key,line) = fields[1],line
if last_key and last_key != key:
if total_purchase_count > 0:
avg = sum/total_purchase_count
else:
avg = 0.0
print last_key ,sep,str(sum),sep, avg,sep,total_purchase_count,sep,suc_closed,sep,fail_closed,sep,suc_withdrawn,sep,suc_pending,sep,not_closed,sep,referrals,sep,p_count,sep,n_count,sep,fields[12]
(sum,total_purchase_count,avg) = 0.0,0,0.0
suc_closed,fail_closed,suc_withdrawn,suc_pending,not_closed = 0,0,0,0,0
referrals = 0
p_count,n_count=0,0
last_key = key
total_count +=1
if fields[6] == "purchasing":
sum += float( fields[10] )
total_purchase_count += 1
elif fields[6] == "login":
logintime = fields[4]
elif fields[6] == "logout":
logouttime = fields[5]
if fields[9] == "suc:closed":
suc_closed +=1
elif fields[9] == "fail:closed":
fail_closed +=1
elif fields[9] == "suc:withdrawn":
suc_withdrawn +=1
elif fields[9] == "suc:pending":
suc_pending +=1
elif fields[9] == "not_closed":
not_closed +=1
if fields[7] == "refer:":
referrals +=1
for item in p_senti:
if item in fields[15]:
p_count += 1
for item in n_senti:
if item in fields[15]:
n_count +=1
print last_key ,sep,str(sum),sep, avg,sep,total_purchase_count,sep,suc_closed,sep,fail_closed,sep,suc_withdrawn,sep,suc_pending,sep,not_closed,sep,referrals
The above program is a Reduce program, it again reads the emitted value from STDIN and starts processing values for each line. Note the use of last_key for determining change in sorted customer id.
Executing Hadoop Jobs.
You need to execute hadoop jobs referencing hadoop*streaming*.jar in your path, specifying map and reduce programs.
#time hadoop jar ../contrib/streaming/hadoop-*streaming*.jar -input /input -output /output_c -mapper 'cmap.py 0 1' -reducer 'cred.py' -file cmap.py -file cred.py
Here are the result:
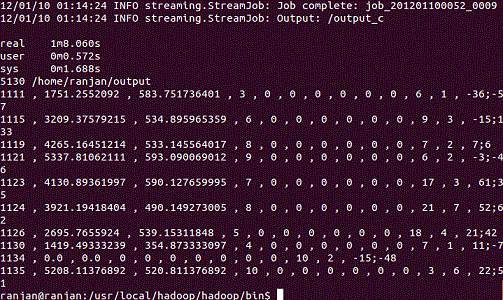
You can see the time taken is approx 1 minute to execute the job. Also first few lines of output is displayed showing customer id, total purchase amount, average purchase amount, with total number of purchases status for each customer, total referrals and a very primitive sentiment analysis on the comments that customers have put in. Using excel on the output data you can do some analysis as shown below on average amount of purchase and sentiment analysis and positive and negative sentiments ( p_senti and n_senti)

Using HANA for Visualization of Hadoop Output Data.
As shown above Hadoop is a batch processing system which took around 1 minute ( single node install ) to crunch unstructured data and produced a report which makes sense and can now be fed into HANA.
Above data can now be loaded into HANA for adhoc analysis at screaming speed. Using the following sql statements after you have created the schema in your HANA system, you can load the csv file from Hadoop by creating a ctl file and executing the following SQL. Check out the HANA documentation on this.
load from 'path/to/ctl/file' threads 4 batch 10000
Using HANA JDBC Api you can easily create REST services with which huge amounts of data can be queried at amazing speed in real time unlike Hadoop, just what we needed for our visualization of thousands of customers ( 15000 customers x 200 activities ) at different locations ( More than 28000 points on earth ) for each activities that they performed.
Below is another visualization using HANA after the Hadoop output data has been fed into it

Data visualization is good and it has given us insights as to how we are performing and about customer behavior. But our systems also needs to learn and make right decisions for us. When this data is fed back into HANA and combined with BPM, systems will be able to make intelligent decisions in real time even under heavy loads. This continuous feedback cycle would produce systems that would not only take the next best action but also predict customer behaviour, trends and take appropriate actions proactively rather than reactively. Sounds far fetched, wait for while for my next blog where I will show what happens when you feed this data in HANA and combine it with BPM.
Let me know your thoughts, you can also reach out to me on twitter @ranjanprj
