
- SAP Community
- Products and Technology
- Technology
- Technology Blogs by SAP
- Web Intelligence: Memory Leak or Sizing Issue? Re...
Technology Blogs by SAP
Learn how to extend and personalize SAP applications. Follow the SAP technology blog for insights into SAP BTP, ABAP, SAP Analytics Cloud, SAP HANA, and more.
Turn on suggestions
Auto-suggest helps you quickly narrow down your search results by suggesting possible matches as you type.
Showing results for
Advisor
Options
- Subscribe to RSS Feed
- Mark as New
- Mark as Read
- Bookmark
- Subscribe
- Printer Friendly Page
- Report Inappropriate Content
08-17-2011
8:47 AM
One of the most difficult challenges for the SAP BusinessObjects Enterprise administrator can be to get a grip on what exactly is consuming the resources of their application servers. More specifically, it is important to understand whether this resource consumption is due to over utilization or due to a performance issue with the application itself. Prior to the release of the remote support component add-on (and Solution Manager) for SAP BusinessObjects Enterprise, there were a few tools and techniques used by SAP support to analyze this type of problem. These tools commonly include JConsole for JVM monitoring, Samurai for thread analysis, and SAP Memory Analyzer, an eclipse plug-in for examining JVM heap dumps. Although very useful, sometimes these utilities are not enough to gain the right insight to solve tricky performance issues. This type of situation is where remote support component shines by providing detailed analysis of internal processes which can be tracked on a historical basis and then examined easily and effectively via the Wily Introscope workstation. Conveniently, this examination of performance data can take place in real-time in the actual SAP BusinessObjects Environment or off-site and offline by an SAP support consultant or developer.
In a recent technical support incident, remote support component was the tool that made the difference and was able to provide the much needed answers. Based on the analysis of the data collected by remote support component, the BusinessObjects administrator was able to confidently make adjustments to their application server tier and ultimately resolve the performance issues.
So, what was the issue?
The application server tier in this SAP BusinessObjects Enterprise XI3.1 SP2 landscape consists of four Apache Tomcat servers fronted by a hardware load balancer. In this weblog, we will refer to the individual Tomcat servers as 1, 2, 3, and 4. Users of this environment mainly view and edit Web Intelligence documents and the environment is utilized twenty four hours a day. Frequently, the Tomcat server was crashing on different nodes in the cluster causing end-users to be load balanced to other nodes. The problem was particularly evident in Tomcat instance 4 as this was the server that crashed most often. In contrast, instance 1 was found to not ever crash. Further inspection of the heap dump revealed that the root cause of the crashing was due to Java heap out of memory. Each node in the cluster was set to have a maximum memory of 1.3 gigabytes. As a workaround, a nightly and sometimes daily restart of Tomcat was scheduled to release all the memory.
The initial and obvious suspicion was that there was a memory leak somewhere in the webapp code and this was causing objects to not be cleaned up, but is this really the case? How do we prove that it is not?
Examining the heap dump revealed the number of sessions, how many objects were opened, and how much memory was used by each object, and whether there was any leak suspects. This however did not provide a smoking gun as to the root cause and to whether or not there was a real memory leak. So, remote support component was installed and configured to monitor the entire Apache Tomcat landscape. Performance data was collected for several days including Monday, which was the day in which the peak load on the environment could be expected. The data was subsequently zipped up and sent to SAP support for analysis.
Let's take a look at the data that was collected by remote support component.
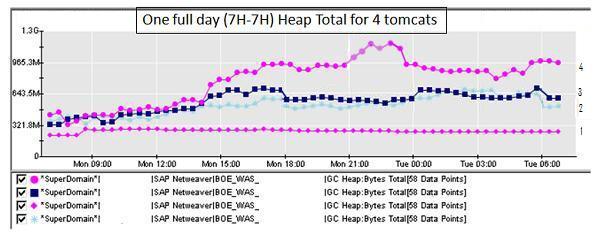
In the graph above we see a breakdown of total heap memory (OutOfMemory indicator) used for each of the four nodes in the cluster. This data is filtered inside Wily Introscope workstation so that only 24 hours of data is displayed. The time range here corresponds to the busiest day of the week which is Monday to Tuesday.
Immediately we can deduce the following information:
- There are issues with the load balancing in this environment
- Server 1 does not appear to be part of the load balancing algorithm
- Server 4 is getting more traffic than it should as compared to the other nodes in the cluster
- If the load balancing were working as it should, the average memory usage would be much lower across the cluster
This is very useful information, but what about the memory leak? As a reference, let's first have a look at the resources used in our lab here at SAP.

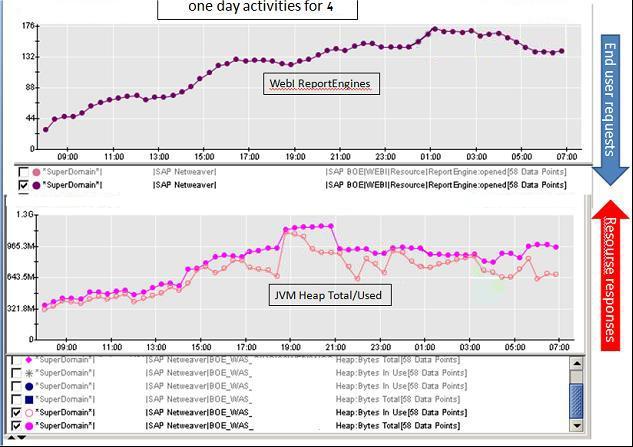
The graphs above show a load test simulating 100 users opening / refreshing a Web Intelligence document and then performing a drill action. The charts are organized on the top according to metrics related to user requests and the bottom charts are organized according to metrics related to server responses. We observe the following:
- When there is an increase of Webi ReportEngines object, there is a proportional increase in JVM Heap total
- As usage declines, garbage collection has an opportunity to do it's business and the Heap total also reduces in size
Now, we take a closer look at our most problematic server 4 and focus on Webi ReportEngines created and the total Heap size.
From the above data we can see that as the number of Webi ReportEngine objects increases the heap size increases as well. At 21:00 hours, we were at a near risk of an OutOfMemory condition. However, as usage decreased slightly, garbage collection kicked in and the total heap size decreased and stabilized. Then, even as the number of Webi ReportEngines increased, the heap remained stable.
With the help of remote support component, we can definitively conclude:
- There is no notable memory leak in the BusinessObjects Enterprise webapp code
- The load balancer needs to be re-configured to properly spread the load across all four servers
- This environment is nearing the threshold for maximum utilization of these four servers and a fifth server could be introduced to allow for additional Webi ReportEngine requests
I hope you enjoyed this deep dive into root cause analysis with remote support component. Please visit our website at http://service.sap.com/rsc for information on how to download and install remote support component in your BusinessObjects Enterprise landscape.
- SAP Managed Tags:
- SAP BusinessObjects Business Intelligence platform
5 Comments
You must be a registered user to add a comment. If you've already registered, sign in. Otherwise, register and sign in.
Labels in this area
-
ABAP CDS Views - CDC (Change Data Capture)
2 -
AI
1 -
Analyze Workload Data
1 -
BTP
1 -
Business and IT Integration
2 -
Business application stu
1 -
Business Technology Platform
1 -
Business Trends
1,661 -
Business Trends
88 -
CAP
1 -
cf
1 -
Cloud Foundry
1 -
Confluent
1 -
Customer COE Basics and Fundamentals
1 -
Customer COE Latest and Greatest
3 -
Customer Data Browser app
1 -
Data Analysis Tool
1 -
data migration
1 -
data transfer
1 -
Datasphere
2 -
Event Information
1,400 -
Event Information
65 -
Expert
1 -
Expert Insights
178 -
Expert Insights
280 -
General
1 -
Google cloud
1 -
Google Next'24
1 -
Kafka
1 -
Life at SAP
784 -
Life at SAP
11 -
Migrate your Data App
1 -
MTA
1 -
Network Performance Analysis
1 -
NodeJS
1 -
PDF
1 -
POC
1 -
Product Updates
4,577 -
Product Updates
330 -
Replication Flow
1 -
RisewithSAP
1 -
SAP BTP
1 -
SAP BTP Cloud Foundry
1 -
SAP Cloud ALM
1 -
SAP Cloud Application Programming Model
1 -
SAP Datasphere
2 -
SAP S4HANA Cloud
1 -
SAP S4HANA Migration Cockpit
1 -
Technology Updates
6,886 -
Technology Updates
408 -
Workload Fluctuations
1
Related Content
- New Machine Learning features in SAP HANA Cloud in Technology Blogs by SAP
- Unify your process and task mining insights: How SAP UEM by Knoa integrates with SAP Signavio in Technology Blogs by SAP
- 10+ ways to reshape your SAP landscape with SAP BTP - Blog 4 Interview in Technology Blogs by SAP
- 10+ ways to reshape your SAP landscape with SAP Business Technology Platform – Blog 4 in Technology Blogs by SAP
- Top Picks: Innovations Highlights from SAP Business Technology Platform (Q1/2024) in Technology Blogs by SAP
Top kudoed authors
| User | Count |
|---|---|
| 13 | |
| 11 | |
| 10 | |
| 9 | |
| 9 | |
| 7 | |
| 6 | |
| 5 | |
| 5 | |
| 5 |