
- SAP Community
- Products and Technology
- Additional Blogs by Members
- AS Java common misconception #1 Enlarging the heap...
Additional Blogs by Members
Turn on suggestions
Auto-suggest helps you quickly narrow down your search results by suggesting possible matches as you type.
Showing results for
TomCenens
Active Contributor
Options
- Subscribe to RSS Feed
- Mark as New
- Mark as Read
- Bookmark
- Subscribe
- Printer Friendly Page
- Report Inappropriate Content
08-10-2011
6:21 AM
Understanding the concept and related technical terms
If you are not familiar with concepts like a java object, heap size and garbage collection I would recommend you first read some of my previous blogs which explain these concepts:
http://www.sdn.sap.com/irj/scn/weblogs?blog=/pub/wlg/22576
http://www.sdn.sap.com/irj/scn/weblogs?blog=/pub/wlg/22707
I do have to point out that since writing the blog on Java VM settings some things have changed. SAPJVM 4.1 has been developed as a replacement for Netweaver 6.40 and 7.0x based SAP systems.
Topic | Platform JVM | SAPJVM 4.1 | SAPJVM 5 | SAPJVM 6 |
Parameter settings | Manually | Manually | Zero Administration Template + Manually | Zero Administration Template + Manually |
Log readability | Bad | Better | Better | Better |
Updating | Requires stop/start of all SAP systems using the same platform JVM on the server | Manual update of binaries + downtime | Automatic update through JSPM + downtime | Automatic update through JSPM + downtime |
Bug fix frequency | When platform vendor decides to patch = not so frequently | When SAP detects issue or customer detects issue or when release cycle is occurring | When SAP detects issue or customer detects issue or when release cycle is occurring | When SAP detects issue or customer detects issue or when release cycle is occurring |
Java technology version | Java 4 (1.4.2) | Java 4 (1.4.2) | Java EE5 | Java EE6 |
Dispatching | Dispatcher node | Dispatcher node | ICM | ICM |
AS Java common misconception #1 Enlarging the heap size to solve the issue
There are general recommendations from SAP to size your AS Java based SAP system in terms of memory settings. The most common sizing recommendation in terms of heap size is a heap size of 2GB. An exception to that recommendation is SAP Netweaver BW which has a recommendation of 2.5GB and the SAP note also states you might have to increase the heap size depending on the usage of the SAP system..
An OOM (out of memory) situation is what is often the trigger for technical teams to start increasing the heap size and while it might help out temporary to keep the AS Java stable and running the root cause should be determined and actions should be taken.
A new SAP AS Java based installation should run on a moderate heap size without any issues. If you encounter severe issues with a small amount of users in parallel or in general you have a large heap size just to get the AS Java started properly you can expect something is seriously wrong.
Tips
Tip #1:Use logical thinking to evaluate the situation
Take a look at the AS Java based SAP system and check if the configuration matches the actual use case. If you have a SAP Netweaver CE 7.2 for example which only has a single customer development running besides SAP standard coding and only a dozen users are working on the system you should know that the system should run fine on the standard settings using a heap size of merely 2GB.
Evaluate the SAP system by checking the parameter configuration, is there anything missing here that can enhance performance (for example concurrent mark sweep is not enabled). Check the use case of the SAP system, how much is standard SAP, how much is custom development, check the sizing according to what is being used, how many users are working in parallel and how many programs or reports are being ran? Does the picture make sense in the end or is it a work of art that is hard to understand?
Tip #2: Check the default tracing in Wily Introscope
Wily Introscope automatically takes traces of certain actions through the Wily Introscope bytecode agent. Those traces can be accessed and provide valuable information on slowdowns or performance bottlenecks in your AS Java based SAP system. I prefer using the Introscope workstation over the webview because the possibilities of the webview are more limited. For that reason the blog content was performed on the Introscope Workstation.
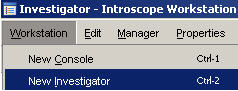
Picture 1.1
Once you have started your Wily Introscope workstation open a new Investigator window. You can do so by accessing the upper menu Workstation --> New Investigator.
The difference between the investigator mode and the console mode is that the console mode offers predefined dashboards delivered by SAP. The Investigator mode offers a tree view and different options to work with.

Picture 1.2
Next set a time range which date/time you wish to check. Depending on whether or not you are aware of a specific date/time issues occur you can also opt to set it to two days for example. In most cases you will probably want to use a smaller time range.

Picture 1.3
In the left lower pane, select a node from a SAP system which you want to check. Under the <hostname> --> SAP Netweaver --> <SID>_<instance>_<node>. In the example my AS Java based SAP system only has one server node so I check out that server node. You don’t necessarily have to be on a metric to be able to retrieve information. If you place the cursor on a higher level node such as a server node you will get all information underneath it depending on which tab you select in the right pane.

Picture 1.4
On the right pane, click on the Traces tab as shown in Picture 1.4. You see different tabs, the default tab is overview which can feature one or more graphics depending on the node in the tree you are located on. Of course the Errors tab is also an interesting one and as I mentioned earlier, placing the cursor on a node such as server0 provides you with all the Errors that were captured from underlying nodes.

Picture 1.5
You will notice in the right pane lower left corner that the word “Searching…” appears (see picture 1.5). This happens when there are many records to be fetched. So please be a little patient and don’t think there are no traces at all, instead check if you see “Searching…” appear after clicking the tab. Soon after it should disappear again and you should see results in your right pane.

Picture 1.6
Next click on the Duration (ms) column to sort the traces from high to low to identify traces of calls which has a high response time.

Picture 1.7
As you can see in picture 1.7 the WebServices RuntimeProcessingEnvironment took 240066 ms which is too much really. I’m not going to argument what the maximum value a call can be. You should use common sense depending on what is in place on the system, how many concurrent users use the system and how large the application is or how much data the application consumes.
A trace like the above is obviously suspicious and should be investigated. The sample is coming from a SAP Netweaver 7.2 CE environment which performed badly. As an administrator you should take a look at the timing this call occurs and check the trace/log files of the AS Java system to see if you can find related entries which can explain the bad performance. You can of course also search for SAP notes and check other metrics in Wily Introscope in the same time range of the call occurrence to see if you can identify related issues. Another possibility to investigate is to perform an End 2 End Trace Analysis and trace the application to see where the time is being wasted to identify the component in which the time is being lost.
If all those steps do not offer a solution you could perform JVM profiling. Using JVM profiling you can perform memory profiling of your Java applications. The actions are performed through the developer studio and enable you to see where resources are being used by your application and possibly you can identify the root cause that way. To make a change based on those results, most often development is required.
To get an idea how memory profiling works you can watch the following demo which was performed on a SAP Netweaver PI system: http://www.sdn.sap.com/irj/scn/events?rid=/library/uuid/40310c4a-90a3-2c10-d99b-a4dc66f4cd3c
Tip #3: Get SAP into the loop
If you can’t figure out the root cause yourself get SAP into the loop and ask their help to know where the issue is coming from. This might seem like an obvious tip but still customers sometimes hesitate to get SAP support in the loop for the AS Java based issues they are encountering. In some cases like in picture 1.0 it’s a problem in the standard SAP coding that surfaces for whatever reason. At that point you will want to cooperate with SAP to get the necessary bug fix patching going to resolve the issue.
I was called in by a customer because they had a SAP Netweaver CE 7.2 installation which had really bad performance. I noticed immediately that the SAP system was really oversized and it only had a small amount of users working concurrently and a single custom application. The traces were pointing to a custom development made by the customer. The parameter settings weren't a hundred percent correct either so I also gave some recommendations to change those.
Together with SAP MaxAttention the issue got solved in a timely matter. The main cause of the performance problem appeared to be the JPA entity relationships which were not using Lazy loading. Apparently it only worked properly if the setting to use Lazy loading was maintained on project level in NWDS. You can check the JPA Monitor as system administrator to see information on all JPA applications running.
2 Comments
Top kudoed authors
| User | Count |
|---|---|
| 1 | |
| 1 | |
| 1 | |
| 1 |