
- SAP Community
- Products and Technology
- Additional Blogs by SAP
- SAP BusinessObjects Performance Testing with Apach...
Additional Blogs by SAP
Turn on suggestions
Auto-suggest helps you quickly narrow down your search results by suggesting possible matches as you type.
Showing results for
Advisor
Options
- Subscribe to RSS Feed
- Mark as New
- Mark as Read
- Bookmark
- Subscribe
- Printer Friendly Page
- Report Inappropriate Content
06-30-2011
1:54 AM
As any SAP BusinessObjects administrator can tell you, sizing an environment can be a challenging task.
Sure there is a fair amount of guidance out there in terms of documentation on how to calculate the amount of CPU and Memory needed to service a given amount of volume, but as with many things, the devil is in the details.
Think about it this way ... the SAP BusinessObjects Enterprise XI 3.1 Sizing Guide suggests a range of 25-40 Web Intelligence connections per CPU. Depending on report complexity and usage patterns, the optimum number could be 25, 40, or somewhere in between. In order to determine the best value, one should consider running a series of performance tests at 25 and 40 and measure how the system behaves under load from real business processes.
Here are some other examples of questions that an administrator might need to answer:
- How much impact do report characteristics such as drill filters, subreports, charting, and data volume have on resource consumption?
- Can my Crystal and Web Intelligence servers safely co-exist on the same physical machine based on specific usage patterns?
- How do I size my Java Application Server to accommodate a specific amount of concurrent usage?
Questions like this, along with concepts like impact analysis of on-boarding new tenants or business units and forecasting server requirements for the refresh of leased hardware can be answered with a solid methodology for Performance Testing.
I'm planning to propose such a foundation in a series of articles I'll be publishing to SDN this year and will provide numerous concrete examples for performance testing in SAP BusinessObjects Enterprise XI 3.1 and SAP Business Intelligence Platform 4.0. The tool I’ve chosen to create and execute the performance tests is Apache JMeter, due primarily to the fact it is free and accessible to the general public. Though some of the steps will, by necessity, be specific to JMeter, I will try to unlock the framework of the BI Platform enough so that the material is relevant to any other load testing tool on the market.
So, how does one develop a performance testing strategy?
At a high level, Load Testing is about three things: sizing, scalability and benchmarking. I'll borrow something that a colleague of mine, Pierre Leroux, said previously on the subject that boils the concept down pretty well:
- It’s about sizing, or translating the business requirements of your customer into actual hardware resource consumption. We need to answer questions as to what kind of hardware resources will be needed to bring BI to ‘n’ number of users with a certain set of technical criteria.
- Performance is about scalability as well, not only because users expect us to deliver guidance with regard to hardware resource consumption, but also because the resource consumption must be predictable as we add more users or process greater volume of data. In other words, we expect consistent average cost per user. If it costs an average of $1 worth of hardware for the first user, it should remain around $1 for user number 10,000.
- It’s about validating our sizing guidelines, which can be done in a variety of ways, but benchmarking is one of the best because it’s done in a controlled environment. By that I mean keeping some of the parameters consistent for 1000 users, 2000 users, so forth and so on.
Pierre is spot on. The first thing to keep in mind is that we should be able to answer questions pertaining to any of these components with our Performance Testing strategy. When you are developing a performance test, try to keep these rules in mind and make sure that each facet of the test is applicable.
I will break down the performance testing lifecycle into 4 steps:
- Discovery
- Design
- Execution
- Analysis
In this post, I will cover Discovery and Design and publish articles specifically targeted to Web Intelligence, Crystal Reports, and Dashboards (Xcelsius) on Execution and Analysis.
Discovery
First, we need to identify a test tool. There are many performance test tools on the market, most of which employ a request based method to simulate user load. The requests can be stored as scripts, database records, or xml data to name a few. Developers use a series of requests to build a test plan that is representative of one or more business processes.
As noted previously, JMeter has been selected for this test, but a number of commercial tools are also available. Some commercial tools, such as LoadRunner, have more support for monitoring and results analysis, with an associated license cost. The test designer must determine a tool to use based on requirements and the needs of the organization.
After a tool is selected, we need to identify the requirements and scope of the performance test, and set an objective for the test itself. One should consider what aspects of performance will be measured, keeping in mind the question(s) intended to be answered by the exercise.
Planning a performance test is complex work. The key to success, however, is simple: Clearly identify your objective and focus on this objective.
Keep in mind the following points:
Make the objective small - Trying to evaluate too many criteria not only wastes time, but can also reduce the effectiveness of the collected data by confusing analysts with irrelevant data.
Focus on the objective – In today’s IT infrastructure, component-oriented applications are a widely accepted standard. This means that a system could include many tiers, and dozens of individual components. The system can also be deployed to numerous machines, as opposed to just one. Therefore, the configuration of a test environment should be carefully designed to isolate the effects of performance as much as possible. The more specific the definition is, the more accurate the results.
For example, the objective of a performance test might be to identify how many CPU(s) of Web Intelligence are required to process 50 concurrent refresh and drill requests of a set of reports. With the intention of determining whether or not a 4 CPU machine can handle this load, we might build our requirements around CPU % per process, Memory per process, and Response Time. We might not be interested in network throughput or Disk I/O statistics.
We should also consider the complexity of the operations, as complexity normally has a direct correlation with Response Time. That is, does it make sense to benchmark using 50 instances of the most complex report, an equal distribution of reports, or a pre-determined combination of simple and complex reports?
We’ll continue with the example above for the remainder of this post and in the first article as well:
Objective – Determine how many CPU(s) are required for Web Intelligence to process 50 concurrent report refresh and drill requests of the ‘Formatted Report for Drill’ sample report in XI 3.1. We’ll try to validate whether or not a single 4 CPU server will be able to handle this amount of load.
Requirements – Measure CPU% per process, Memory per process, and Response Time of requests for the duration of the test. A successful test would result in average resource consumption (CPU and Memory) <85% and average Response Time < 90s. Max Response Time should not exceed 120s.
Scope – 2 machines, 4CPU, 8GB Memory, Windows 2008 R2, XI3.1 SP4. 1 machine will host Tomcat and the XI 3.1 services, and the other machine will be used to run JMeter.
The final design plan should take into consideration all of the business requirements identified during Discovery, while ensuring that only necessary steps are included in the test.
In the scenario above, does it make sense to simulate 50 concurrent Web Intelligence refresh requests via openDocument, or by passing the necessary requests to navigate to the document via InfoView? The test plan owner should decide which process flow is more representative of the business usage, and build the plan accordingly. The decision can have far reaching consequences to the outcome of the test, and should be carefully considered. That is, navigating through an environment with hundreds of top level folders and a complex rights structure requires more physical resources from the CMS and Java Application Server than it would if all reports were accessed via URL reporting.
Design
The selection and design of test scenarios directly affect the outcome of your results. The resource and response time cost of different scenarios can differ substantially depending on complexity. Furthermore, the frequency in which certain scenarios are followed by business users must also be considered in order to test workflows that are truly applicable to normal usage.
Unless the stakeholders (business users or infrastructure) would like to test a specific scenario, the performance of a web application should be evaluated by its most frequently used scenarios.
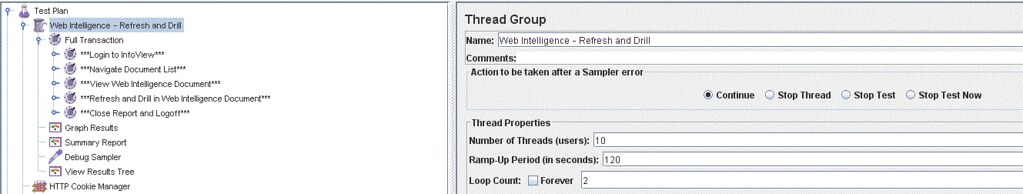
Using the XI 3.1 InfoView as an example, the most common workflow in an environment might look like this:
- Log On
- Navigate to Document List and expand a folder
- View, Refresh, and Drill in a Web Intelligence Report
- Log Out
It is important to build the test scenario to be relevant to standard business usage, so consider using information from the Audit Database to identify the most commonly used reports. This information is relevant when sizing for specific tenants or LOB customers, or when stress testing the overall capacity of a shared environment.
Upon completion of this step, we should have a clear set of steps recorded for use in our Test Plan. JMeter provides an HTTP Proxy Server component, which allows a user to interact with a web application such as SAP BusinessObjects Enterprise XI3.1, using your normal browser. JMeter records each Uniform Resource Identifier (URI) or page request, along with headers, form values, and query strings, and stores them for later use. Each request can be manipulated to emulate a large number of users, and leveraged as the foundation of a Test Plan. A test plan describes a series of steps JMeter will execute when run.
I'll cover the execution and analysis phases of this example in my first article on SDN.
Creating a Test Plan
JMeter itself cannot do much to help us plan our performance test, but it does provide a few key pieces of functionality that help us tailor our test plan:
1. Remote Testing – Using a single machine to emulate thousands of users can be problematic, in that the machine itself can become a bottleneck due to insufficient resources. The remote testing feature of JMeter allows us to concurrently launch test scripts from multiple machines. Thus, the performance of the test machines is isolated. More details about the remote testing feature of JMeter can be found here.
2. Emulating Multiple Users – In a multi-user web application, every user accesses the application with their own identity and own data. Normally, a test script stores static data, which amounts to the same user running the script over and over. This is not acceptable for an enterprise environment and there is a need for dynamic data. JMeter allows us to customize for multiple users through a set of listeners and samplers. These tools allow us to emulate hundreds or thousands of users, by associating threads in the application with a specific username, and retrieving dynamic data such as JSESSIONID for use in our test scripts. JMeter also allows us to store a unique set of cookies for each user.
Planning a performance test also consists of configuring the test environment, scheduling the test and defining time lines, and determining how to collect data for analysis.
In summary, the test plan not only consists of the recorded steps of a test scenario, but it also contains all of the supporting components to add dynamic users, perform remote testing, and collect data.
I'm going to leave you with the Apache JMeter URL that has been immensely helpful to me as I've gotten acquainted with the tool. I'm setting myself an aggressive target to have the first article in the SDN approval process by July 15, 2011. Although the content is entirely finished I am now facing the not insignificant task of modifying the format to fit the SDN template.
2 weeks is surely enough time to get that done though right?
http://jakarta.apache.org/jmeter/index.html
3 Comments
Related Content
- Deep dive into Q4 2023, What’s New in SAP Cloud ALM for Implementation Blog Series in Technology Blogs by SAP
- SAP Commerce Cloud Q1 ‘24 Release Highlights in CRM and CX Blogs by SAP
- IBP Excel-add huge performance latency in APAC and EMEA in Supply Chain Management Q&A
- How leading global Chemicals Supplier BYK harmonized Supply Chain Planning across Divisions in Supply Chain Management Blogs by SAP
- SAP Datasphere - Space, Data Integration, and Data Modeling Best Practices in Technology Blogs by SAP