
- SAP Community
- Products and Technology
- Technology
- Technology Blogs by Members
- Solution Manager - E2E Trace Analysis
Technology Blogs by Members
Explore a vibrant mix of technical expertise, industry insights, and tech buzz in member blogs covering SAP products, technology, and events. Get in the mix!
Turn on suggestions
Auto-suggest helps you quickly narrow down your search results by suggesting possible matches as you type.
Showing results for
TomCenens
Active Contributor
Options
- Subscribe to RSS Feed
- Mark as New
- Mark as Read
- Bookmark
- Subscribe
- Printer Friendly Page
- Report Inappropriate Content
03-02-2011
11:49 PM
Introduction
Hello SCN Community
The product root cause analysis or also referred to as diagnostics for SAP Solution Manager is often discussed or brought up in webinars, podcasts but it seems not that many community members use it or have it installed.
While there is room for improvement I very much like this product, since I'm an administrator it can help me out to perform troubleshooting in a faster way. To do something about the fact that many don't know what you can do with it, I decided to create some blogs (starting with this one) on different aspects of root cause analysis and showcase some real data or real situations.
E2E Trace Analysis
In Solution Manager 7.0 EHP1 you have five big tools in root cause analysis which are workload analysis, change analysis, trace analysis, exception analysis and Wily Introscope. There are also a bunch of related tools that offer interesting functionality, for example Thread Dump Analysis, File system Browser, OS Command Console, Change Reporting , Expert Analysis and so on.
In this blog I will show some data of E2E Trace Analysis. E2E stands for End to End which means we will trace from the users front-end through multiple SAP systems all the way to the backend host and back. The scenario performs HTTP tracing so it is not a replacement for ABAP tools which trace an ABAP transaction which does not use HTTP.
My experience
I have followed SAP course E2E100 (Root Cause Analysis) which gives theory on the tools and also gives hands on exercises to use the tools. It doesn't feature technical implementation. The course was interesting as I had a good teacher with in-depth knowledge on the subject so I could raise questions along the course. I'm also certified as Root Cause Analysis Expert - SAP E2E Solution Operations.
I have performed implementations for multiple customers and I also use the product for those customers. You can perform an analysis of a problem at the moment it occurs or afterwards but the product doesn't offer alerting (at least not free of charge).
Next week I'm off again to perform another implementation of root cause analysis.
SolBros podcast
I heard someone ask a question on the need to stop/start managed SAP systems after performing the setup in the SolBros podcast (which I recommend you check out if you are into Solution Manager). The way I handle this is that I perform the setup on day one and then the next day I start before business hours and stop/start the SAP system myself, that way I can check the logs afterwards to see if everything is working properly. If I detect issues, I then still have the necessary time to make a change where needed, rerun the setup and stop/start the SAP system again. If SAP can change this so it can be done online it would mean the product would be much more attractive.
Technical configuration in short
Prerequisite is of course that root cause analysis is configured. The configuration which I might blog in more detail some time contains Wily Introscope, the root cause analysis (or diagnostics) scenario which you can setup through transaction SOLMAN_SETUP (wizard based action list), an Introscope Agent (ISAGENT Java Component on your Solution Manager), a host agent (running SAPOsCol etc) on each physical server that will be connected and a diagnostics agent (also called SMD agent) for each managed SAP system. Once you have those in place you also have to run a managed system setup and Wily agent setup for the SAP systems that need to be integrated in root cause analysis and finally you have to stop/start the managed SAP system to enable the data capturing.
If you have enough patience I might build some blogs to set you on your way for the technical configuration.
Accessing root cause analysis

picture 1.1
You can access root cause analysis through the easy access menu given you have the authorization or through the Solution Manager workcenter (transaction SOLMAN_WORKCENTER).
Accessing End-To-End Trace Analysis
There you can either choose End-To-End Trace Analysis in the menu on the left (not visible in screenshot) or you click on End-To-End Analysis.
![]()
picture 1.2
This will change the right pane and it will offer tabs in which you can see a list of managed SAP systems.It is also possible to build your own tabs which are available for your own user-id by the Define New Query option on the right hand side. This way you can create tabs for certain solutions or for SAP system that belong together if you have a large amount of SAP systems. The screenshot I have taken is from a test environment. I have other sources where there are much more (referring to the numbers next to ABAP Systems and Java Systems in picture 1.2).
![]()
![]()
picture 1.3
Under the tabs shown in picture 1.2 you find the main tools that can be accessed which I referred to in the beginning of the blog.
![]()
picture 1.4
Yes I used Photoshop for picture 1.4 before someone asks. On picture 1.4 you can see SAP Enterprise Portals, one version 6.40 and one version 7.0. Imagine both portals are connected together and content that is displayed on a web page is coming from both of them, certain parts from AA1, and other parts from BB1.
Tracing multiple SAP systems

picture 1.5
The question now is: how do you trace multiple SAP systems? This is how: Select the first SAP system, AA1 in the example by clicking in the column which is in front of System ID (I placed red cursor on it to make it visible in picture 1.5). Once the line AA1 is selected, hold the Ctrl key on your keyboard and click on the field below the field you just selected to also select BB1. The result should be that both SAP system lines are highlighted as shown in picture 1.5.
Next hit the Trace Analysis button which you can see on the top of picture 1.5.

picture 1.6
The Trace Analysis application will now be started (see picture 1.6).
Before you can actually start tracing you have to Trace Enable the SAP systems which are going to be involved. Click on the Trace Enabling tab to proceed (see picture 1.6).

picture 1.7
Here you will see the SAP systems you have selected before (AA1 and BB1 in the example) and you can enable one by one by selecting the line and clicking enable at the bottom or all at once by clicking Enable All on the top.

picture 1.8
Once you have chosen to enable, the application will trigger the necessary changes in the satellite system so it will trace content (to be able to trace you have to maintain trace parameters so this application does that for you which is useful and necessary because else it would mean a lot of manual actions would be required).

picture 1.9
Once the changes are done, you will see the state changes into a green square, stating the tracing can take place.


picture 2.0
In the Options tab you have some more options which you can select to influence the tracing. The EEM options on the bottom are related to the End-User Experience monitoring (EEM). End-User Experience monitoring uses diagnostics agent to monitor the performance of SAP HTTP based applications. You should look it up as it's definitely interesting content. It's most useful for system administrators to identify which step of an HTTP based application has bad performance.
How do you start the trace?
Ok so now we have the settings in place (SAP systems chosen, enabled for tracing and options left on default) but how do you initiate the trace then? The trace is initiated by the SAP Client Plug-in which can be downloaded from SAP Note 1435190.

picture 2.1
You then install the SAP Client Plug-in on your laptop or device which you are using and start the plug-in starter GUI to get started. You can see the tool started up in picture 2.1. I also opened the dropdown box to show the options. I used Internet Explorer (No support for Mozilla Firefox). You can check the SAP note mentioned previously for versions which are supported and the OS that you should have for them.

picture 2.2
Once you have chosen, click the Launch button. It is recommended to close all other Internet Explorer windows to prevent any capturing of data outside of the SAP which you want to trace (see picture 2.2).Your trace shouldn't be influenced if you don't have any dynamic auto refreshing pages open and basically no activity of other web pages.

picture 2.3
A new Internet Explorer window will open and you will see the following screen in the SAP client plug-in (see picture 2.3). Fill in a description so you can recognize your trace afterwards in the Business Transaction Name.
On the low right corner you can maintain the SMD Host (Solution Manager) and the SMD HTTP port (standard J2EE port of your Solution Manager). You don't have to maintain the Term ID because it will get filled in automatically. If you fill in the SMD Host and Port, the trace will be sent to the Solution Manager automatically. If you don't fill in the details, the application will save an XML file (BusinessTransaction.xml) to your local disk and you can upload that XML file in Trace Analysis in your Solution Manager.
You also have the choice to cut the tracing in pieces using steps. If you have a short trace, don't bother using it. If you trace for a long amount of time or you want to investigate very specific steps, you can use the steps. You can change the step name so you can identify which step contains which operations. To start the actual trace, hit the Start Transaction button (see picture 2.3).

picture 2.4
Once the trace is running perform the actions in the web application (for example clicking a button and loading an iView in portal). You will then see the Sent Byes, Received Bytes, Requests and Reponses number go up (see picture 2.4).
Trace end

picture 2.5
The end of the tracing is triggered by pushing the Stop Transaction button (see picture 2.5).
![]()
picture 2.6
Then either the data gets uploaded to Solution Manager automatically because you maintained the SMD Host and SMD HTTP Port in the SAP Client Plug-in or an XML file (BusinessTransaction.xml) is saved on your local disk which you can upload in the Solution Manager (as mentioned in the previous section).
Checking the Trace results

picture 2.7
To check the trace results go have to go back to the Trace Analysis application. Follow the same path as described earlier if you don't have the application open anymore. There you will then either find a new entry in the Business Transactions table after you hit the refresh button or you first have to upload your file using the manual upload option which you see at the bottom of picture 2.7. Once you have uploaded the XML, a new line should appear in the table.
In picture 2.7 you can see that the middle trace (I Photoshopped out the description) was fully processed, hence the green light under the state column.

picture 2.8
What do I mean with fully processed? End-to-End tracing does not only trace the HTTP activity on the SAP systems you selected, it can also collect and analyze log files that were written at the date/time you executed the trace.
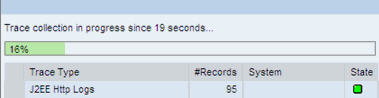
picture 2.9
Once you select the line in the Business Transactions table (see picture 2.7) the logs and traces of the SAP systems previously selected will be collected (see picture 2.9) and perhaps even slightly more (checkbox Select systems for trace collection dynamically in picture 2.8) if the trace collection finds other involved SAP systems and has access to them.

picture 3.0
After the logs and traces are collected, you will find a new table called Transaction Steps underneath the Business Transaction table. This table offers the step name, the timing, the trace level, the number of messages and the duration of the step in milliseconds. The trace step took 74057 ms which is 74 seconds.
To view the results of the trace step, select the line(s) and click on the Display button below the table.
HTTP analysis

picture 3.1
You will then see the result of the trace. The data shown above is the HTTP Analysis data. There is also a section for Server Analysis data. The page is much larger but I will discuss the lower parts further in this blog. A button which catches the eye on picture 3.1 is the Auto-Analysis button.
![]()
picture 3.2
When you hit this button you will taken to the HTTP Messages Table tab and the HTTP messages will get auto analyzed and sorted. The cursor will be placed on the heaviest HTTP message. Before checking the HTTP messages table, it's a good idea to take a look at the component pie.
The component pie

picture 3.3
I'm not really a pie eater, I do like chocolate pie but it's one of the few types of pies I like. Besides chocolate pie I also like the component pie (see picture 3.3). It basically shows the main components that were captured in the trace. The idea behind it is to be able to determine in which component a problem resides so you can perform a more detailed investigation on that component.
If you look closely at the pie you can see a big portion of it is Network time. This is an actual pie from a real trace that I did (I didn't Photoshop this).

picture 3.4
The pie is also accompanied by calculations so you can also see in digits what time was spent on a certain component (see picture 3.4). You can see there was a whopping 43% time spent on network time. There was indeed a bottleneck in the network in this case. It's often up to the administrator to prove that the bottleneck is not the SAP application, this kind of information can easily point out the component where the bottleneck lies. Of course it is not always this visible, I was lucky to bump into this great example.
The Server time distribution among hosts pie

picture 3.5

picture 3.6
The server time distribution among hosts pie offers the hosts which are involved in the trace and the time and % spent on those hosts (see picture 3.5 and picture 3.6).
The HTTP response pie

picture 3.7
There is also a HTTP response pie (see picture 3.7) which shows how many HTTP return codes were successful and how many threw errors. The return codes 404 are erroneous return codes. You can check which HTTP messages returned error code 404 in the HTTP Messages Table tab (shown in next section).
HTTP messages table

picture 3.8
Another tab in the HTTP Analysis section is the HTTP Messages Table (see picture 3.8). I'm not going to discuss the HTTP Messages Graphics tab to try and reduce the blog size as it offers the same content but displayed differently (table vs. graphical overview).

picture 3.9
Normally you will see the URL in the URL column but I erased it because I cannot show the real URL. You can exclude certain URL's (by default css, js, gif, jpg, png is not taken into account). The column on the right side are status, client preprocessing time, HTTP response time (client),Execution time on server side, client rendering time, bytes sent from client to server and bytes sent from server to client.
You can see the sRT is displayed in red automatically which shows a bad rating for this HTTP message. The buttons on the left top corner (see picture 3.9) are used to view details, show or hide static content and so on. You can also see the client message headers and server message headers which is useful to troubleshoot SSO issues or to check what is done with the content. For example you could find Content-Encoding type gzip in the server response header. If the HTTP message is time consuming you should take a look at the message and check whether zipping the content makes sense or not.
Server Analysis
picture 4.0
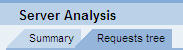
There is also a section on server analysis at the bottom of the page (no matter which tab you are in). It offers a Summary tab and a Requests tree tab. The summary tab shows a system overview of involved systems and how much time was spent on server side.

picture 4.1
The Requests tree tab shows data specific for time spent on server side. You can see the Net time spent, the CPU time spent, the DB time spent. When you see an icon in the most right column you can also view the SQL statements that were executed on server side along with their timing.
End-note
I hope I got some more information out in the open and hopefully some of the blog readers now have a better sight on what trace analysis offers. There are a lot of possibilities using the trace analysis tool. I touched some points here but there is more of course. If you have root cause analysis in place, you should give this a try.
- SAP Managed Tags:
- SAP Solution Manager
14 Comments
You must be a registered user to add a comment. If you've already registered, sign in. Otherwise, register and sign in.
Labels in this area
-
"automatische backups"
1 -
"regelmäßige sicherung"
1 -
"TypeScript" "Development" "FeedBack"
1 -
505 Technology Updates 53
1 -
ABAP
14 -
ABAP API
1 -
ABAP CDS Views
2 -
ABAP CDS Views - BW Extraction
1 -
ABAP CDS Views - CDC (Change Data Capture)
1 -
ABAP class
2 -
ABAP Cloud
2 -
ABAP Development
5 -
ABAP in Eclipse
1 -
ABAP Platform Trial
1 -
ABAP Programming
2 -
abap technical
1 -
absl
2 -
access data from SAP Datasphere directly from Snowflake
1 -
Access data from SAP datasphere to Qliksense
1 -
Accrual
1 -
action
1 -
adapter modules
1 -
Addon
1 -
Adobe Document Services
1 -
ADS
1 -
ADS Config
1 -
ADS with ABAP
1 -
ADS with Java
1 -
ADT
2 -
Advance Shipping and Receiving
1 -
Advanced Event Mesh
3 -
AEM
1 -
AI
7 -
AI Launchpad
1 -
AI Projects
1 -
AIML
9 -
Alert in Sap analytical cloud
1 -
Amazon S3
1 -
Analytical Dataset
1 -
Analytical Model
1 -
Analytics
1 -
Analyze Workload Data
1 -
annotations
1 -
API
1 -
API and Integration
3 -
API Call
2 -
Application Architecture
1 -
Application Development
5 -
Application Development for SAP HANA Cloud
3 -
Applications and Business Processes (AP)
1 -
Artificial Intelligence
1 -
Artificial Intelligence (AI)
5 -
Artificial Intelligence (AI) 1 Business Trends 363 Business Trends 8 Digital Transformation with Cloud ERP (DT) 1 Event Information 462 Event Information 15 Expert Insights 114 Expert Insights 76 Life at SAP 418 Life at SAP 1 Product Updates 4
1 -
Artificial Intelligence (AI) blockchain Data & Analytics
1 -
Artificial Intelligence (AI) blockchain Data & Analytics Intelligent Enterprise
1 -
Artificial Intelligence (AI) blockchain Data & Analytics Intelligent Enterprise Oil Gas IoT Exploration Production
1 -
Artificial Intelligence (AI) blockchain Data & Analytics Intelligent Enterprise sustainability responsibility esg social compliance cybersecurity risk
1 -
ASE
1 -
ASR
2 -
ASUG
1 -
Attachments
1 -
Authorisations
1 -
Automating Processes
1 -
Automation
2 -
aws
2 -
Azure
1 -
Azure AI Studio
1 -
B2B Integration
1 -
Backorder Processing
1 -
Backup
1 -
Backup and Recovery
1 -
Backup schedule
1 -
BADI_MATERIAL_CHECK error message
1 -
Bank
1 -
BAS
1 -
basis
2 -
Basis Monitoring & Tcodes with Key notes
2 -
Batch Management
1 -
BDC
1 -
Best Practice
1 -
bitcoin
1 -
Blockchain
3 -
bodl
1 -
BOP in aATP
1 -
BOP Segments
1 -
BOP Strategies
1 -
BOP Variant
1 -
BPC
1 -
BPC LIVE
1 -
BTP
12 -
BTP Destination
2 -
Business AI
1 -
Business and IT Integration
1 -
Business application stu
1 -
Business Application Studio
1 -
Business Architecture
1 -
Business Communication Services
1 -
Business Continuity
1 -
Business Data Fabric
3 -
Business Partner
12 -
Business Partner Master Data
10 -
Business Technology Platform
2 -
Business Trends
4 -
CA
1 -
calculation view
1 -
CAP
3 -
Capgemini
1 -
CAPM
1 -
Catalyst for Efficiency: Revolutionizing SAP Integration Suite with Artificial Intelligence (AI) and
1 -
CCMS
2 -
CDQ
12 -
CDS
2 -
Cental Finance
1 -
Certificates
1 -
CFL
1 -
Change Management
1 -
chatbot
1 -
chatgpt
3 -
CL_SALV_TABLE
2 -
Class Runner
1 -
Classrunner
1 -
Cloud ALM Monitoring
1 -
Cloud ALM Operations
1 -
cloud connector
1 -
Cloud Extensibility
1 -
Cloud Foundry
4 -
Cloud Integration
6 -
Cloud Platform Integration
2 -
cloudalm
1 -
communication
1 -
Compensation Information Management
1 -
Compensation Management
1 -
Compliance
1 -
Compound Employee API
1 -
Configuration
1 -
Connectors
1 -
Consolidation Extension for SAP Analytics Cloud
2 -
Control Indicators.
1 -
Controller-Service-Repository pattern
1 -
Conversion
1 -
Cosine similarity
1 -
cryptocurrency
1 -
CSI
1 -
ctms
1 -
Custom chatbot
3 -
Custom Destination Service
1 -
custom fields
1 -
Customer Experience
1 -
Customer Journey
1 -
Customizing
1 -
cyber security
3 -
cybersecurity
1 -
Data
1 -
Data & Analytics
1 -
Data Aging
1 -
Data Analytics
2 -
Data and Analytics (DA)
1 -
Data Archiving
1 -
Data Back-up
1 -
Data Flow
1 -
Data Governance
5 -
Data Integration
2 -
Data Quality
12 -
Data Quality Management
12 -
Data Synchronization
1 -
data transfer
1 -
Data Unleashed
1 -
Data Value
8 -
database tables
1 -
Datasphere
3 -
datenbanksicherung
1 -
dba cockpit
1 -
dbacockpit
1 -
Debugging
2 -
Delimiting Pay Components
1 -
Delta Integrations
1 -
Destination
3 -
Destination Service
1 -
Developer extensibility
1 -
Developing with SAP Integration Suite
1 -
Devops
1 -
digital transformation
1 -
Documentation
1 -
Dot Product
1 -
DQM
1 -
dump database
1 -
dump transaction
1 -
e-Invoice
1 -
E4H Conversion
1 -
Eclipse ADT ABAP Development Tools
2 -
edoc
1 -
edocument
1 -
ELA
1 -
Embedded Consolidation
1 -
Embedding
1 -
Embeddings
1 -
Employee Central
1 -
Employee Central Payroll
1 -
Employee Central Time Off
1 -
Employee Information
1 -
Employee Rehires
1 -
Enable Now
1 -
Enable now manager
1 -
endpoint
1 -
Enhancement Request
1 -
Enterprise Architecture
1 -
ETL Business Analytics with SAP Signavio
1 -
Euclidean distance
1 -
Event Dates
1 -
Event Driven Architecture
1 -
Event Mesh
2 -
Event Reason
1 -
EventBasedIntegration
1 -
EWM
1 -
EWM Outbound configuration
1 -
EWM-TM-Integration
1 -
Existing Event Changes
1 -
Expand
1 -
Expert
2 -
Expert Insights
2 -
Exploits
1 -
Fiori
14 -
Fiori Elements
2 -
Fiori SAPUI5
12 -
Flask
1 -
Full Stack
8 -
Funds Management
1 -
General
1 -
General Splitter
1 -
Generative AI
1 -
Getting Started
1 -
GitHub
8 -
Grants Management
1 -
GraphQL
1 -
groovy
1 -
GTP
1 -
HANA
6 -
HANA Cloud
2 -
Hana Cloud Database Integration
2 -
HANA DB
2 -
HANA XS Advanced
1 -
Historical Events
1 -
home labs
1 -
HowTo
1 -
HR Data Management
1 -
html5
8 -
HTML5 Application
1 -
Identity cards validation
1 -
idm
1 -
Implementation
1 -
input parameter
1 -
instant payments
1 -
Integration
3 -
Integration Advisor
1 -
Integration Architecture
1 -
Integration Center
1 -
Integration Suite
1 -
intelligent enterprise
1 -
iot
1 -
Java
1 -
job
1 -
Job Information Changes
1 -
Job-Related Events
1 -
Job_Event_Information
1 -
joule
4 -
Journal Entries
1 -
Just Ask
1 -
Kerberos for ABAP
8 -
Kerberos for JAVA
8 -
KNN
1 -
Launch Wizard
1 -
Learning Content
2 -
Life at SAP
5 -
lightning
1 -
Linear Regression SAP HANA Cloud
1 -
Loading Indicator
1 -
local tax regulations
1 -
LP
1 -
Machine Learning
2 -
Marketing
1 -
Master Data
3 -
Master Data Management
14 -
Maxdb
2 -
MDG
1 -
MDGM
1 -
MDM
1 -
Message box.
1 -
Messages on RF Device
1 -
Microservices Architecture
1 -
Microsoft Universal Print
1 -
Middleware Solutions
1 -
Migration
5 -
ML Model Development
1 -
Modeling in SAP HANA Cloud
8 -
Monitoring
3 -
MTA
1 -
Multi-Record Scenarios
1 -
Multiple Event Triggers
1 -
Myself Transformation
1 -
Neo
1 -
New Event Creation
1 -
New Feature
1 -
Newcomer
1 -
NodeJS
2 -
ODATA
2 -
OData APIs
1 -
odatav2
1 -
ODATAV4
1 -
ODBC
1 -
ODBC Connection
1 -
Onpremise
1 -
open source
2 -
OpenAI API
1 -
Oracle
1 -
PaPM
1 -
PaPM Dynamic Data Copy through Writer function
1 -
PaPM Remote Call
1 -
PAS-C01
1 -
Pay Component Management
1 -
PGP
1 -
Pickle
1 -
PLANNING ARCHITECTURE
1 -
Popup in Sap analytical cloud
1 -
PostgrSQL
1 -
POSTMAN
1 -
Process Automation
2 -
Product Updates
4 -
PSM
1 -
Public Cloud
1 -
Python
4 -
Qlik
1 -
Qualtrics
1 -
RAP
3 -
RAP BO
2 -
Record Deletion
1 -
Recovery
1 -
recurring payments
1 -
redeply
1 -
Release
1 -
Remote Consumption Model
1 -
Replication Flows
1 -
research
1 -
Resilience
1 -
REST
1 -
REST API
2 -
Retagging Required
1 -
Risk
1 -
Rolling Kernel Switch
1 -
route
1 -
rules
1 -
S4 HANA
1 -
S4 HANA Cloud
1 -
S4 HANA On-Premise
1 -
S4HANA
3 -
S4HANA_OP_2023
2 -
SAC
10 -
SAC PLANNING
9 -
SAP
4 -
SAP ABAP
1 -
SAP Advanced Event Mesh
1 -
SAP AI Core
8 -
SAP AI Launchpad
8 -
SAP Analytic Cloud Compass
1 -
Sap Analytical Cloud
1 -
SAP Analytics Cloud
4 -
SAP Analytics Cloud for Consolidation
3 -
SAP Analytics Cloud Story
1 -
SAP analytics clouds
1 -
SAP BAS
1 -
SAP Basis
6 -
SAP BODS
1 -
SAP BODS certification.
1 -
SAP BTP
21 -
SAP BTP Build Work Zone
2 -
SAP BTP Cloud Foundry
6 -
SAP BTP Costing
1 -
SAP BTP CTMS
1 -
SAP BTP Innovation
1 -
SAP BTP Migration Tool
1 -
SAP BTP SDK IOS
1 -
SAP Build
11 -
SAP Build App
1 -
SAP Build apps
1 -
SAP Build CodeJam
1 -
SAP Build Process Automation
3 -
SAP Build work zone
10 -
SAP Business Objects Platform
1 -
SAP Business Technology
2 -
SAP Business Technology Platform (XP)
1 -
sap bw
1 -
SAP CAP
2 -
SAP CDC
1 -
SAP CDP
1 -
SAP CDS VIEW
1 -
SAP Certification
1 -
SAP Cloud ALM
4 -
SAP Cloud Application Programming Model
1 -
SAP Cloud Integration for Data Services
1 -
SAP cloud platform
8 -
SAP Companion
1 -
SAP CPI
3 -
SAP CPI (Cloud Platform Integration)
2 -
SAP CPI Discover tab
1 -
sap credential store
1 -
SAP Customer Data Cloud
1 -
SAP Customer Data Platform
1 -
SAP Data Intelligence
1 -
SAP Data Migration in Retail Industry
1 -
SAP Data Services
1 -
SAP DATABASE
1 -
SAP Dataspher to Non SAP BI tools
1 -
SAP Datasphere
9 -
SAP DRC
1 -
SAP EWM
1 -
SAP Fiori
3 -
SAP Fiori App Embedding
1 -
Sap Fiori Extension Project Using BAS
1 -
SAP GRC
1 -
SAP HANA
1 -
SAP HCM (Human Capital Management)
1 -
SAP HR Solutions
1 -
SAP IDM
1 -
SAP Integration Suite
9 -
SAP Integrations
4 -
SAP iRPA
2 -
SAP LAGGING AND SLOW
1 -
SAP Learning Class
1 -
SAP Learning Hub
1 -
SAP Odata
2 -
SAP on Azure
1 -
SAP PartnerEdge
1 -
sap partners
1 -
SAP Password Reset
1 -
SAP PO Migration
1 -
SAP Prepackaged Content
1 -
SAP Process Automation
2 -
SAP Process Integration
2 -
SAP Process Orchestration
1 -
SAP S4HANA
2 -
SAP S4HANA Cloud
1 -
SAP S4HANA Cloud for Finance
1 -
SAP S4HANA Cloud private edition
1 -
SAP Sandbox
1 -
SAP STMS
1 -
SAP successfactors
3 -
SAP SuccessFactors HXM Core
1 -
SAP Time
1 -
SAP TM
2 -
SAP Trading Partner Management
1 -
SAP UI5
1 -
SAP Upgrade
1 -
SAP Utilities
1 -
SAP-GUI
8 -
SAP_COM_0276
1 -
SAPBTP
1 -
SAPCPI
1 -
SAPEWM
1 -
sapmentors
1 -
saponaws
2 -
SAPS4HANA
1 -
SAPUI5
5 -
schedule
1 -
Script Operator
1 -
Secure Login Client Setup
8 -
security
9 -
Selenium Testing
1 -
Self Transformation
1 -
Self-Transformation
1 -
SEN
1 -
SEN Manager
1 -
service
1 -
SET_CELL_TYPE
1 -
SET_CELL_TYPE_COLUMN
1 -
SFTP scenario
2 -
Simplex
1 -
Single Sign On
8 -
Singlesource
1 -
SKLearn
1 -
Slow loading
1 -
soap
1 -
Software Development
1 -
SOLMAN
1 -
solman 7.2
2 -
Solution Manager
3 -
sp_dumpdb
1 -
sp_dumptrans
1 -
SQL
1 -
sql script
1 -
SSL
8 -
SSO
8 -
Substring function
1 -
SuccessFactors
1 -
SuccessFactors Platform
1 -
SuccessFactors Time Tracking
1 -
Sybase
1 -
system copy method
1 -
System owner
1 -
Table splitting
1 -
Tax Integration
1 -
Technical article
1 -
Technical articles
1 -
Technology Updates
14 -
Technology Updates
1 -
Technology_Updates
1 -
terraform
1 -
Threats
2 -
Time Collectors
1 -
Time Off
2 -
Time Sheet
1 -
Time Sheet SAP SuccessFactors Time Tracking
1 -
Tips and tricks
2 -
toggle button
1 -
Tools
1 -
Trainings & Certifications
1 -
Transformation Flow
1 -
Transport in SAP BODS
1 -
Transport Management
1 -
TypeScript
2 -
ui designer
1 -
unbind
1 -
Unified Customer Profile
1 -
UPB
1 -
Use of Parameters for Data Copy in PaPM
1 -
User Unlock
1 -
VA02
1 -
Validations
1 -
Vector Database
2 -
Vector Engine
1 -
Visual Studio Code
1 -
VSCode
1 -
Vulnerabilities
1 -
Web SDK
1 -
work zone
1 -
workload
1 -
xsa
1 -
XSA Refresh
1
- « Previous
- Next »
Related Content
- Start page of SAP Signavio Process Insights, discovery edition, the 4 pillars and documentation in Technology Blogs by SAP
- How to use AI services to translate Picklists in SAP SuccessFactors - An example in Technology Blogs by SAP
- Improving Time Management in SAP S/4HANA Cloud: A GenAI Solution in Technology Blogs by SAP
- SAP Signavio is the highest ranked Leader in the SPARK Matrix™ Digital Twin of an Organization (DTO) in Technology Blogs by SAP
- SAP HANA Cloud's Vector Engine vs. HANA on-premise in Technology Blogs by Members
Top kudoed authors
| User | Count |
|---|---|
| 6 | |
| 5 | |
| 5 | |
| 5 | |
| 5 | |
| 4 | |
| 4 | |
| 4 | |
| 3 | |
| 3 |