
- SAP Community
- Products and Technology
- Additional Blogs by Members
- Digging source code in a documentation desert
Additional Blogs by Members
Turn on suggestions
Auto-suggest helps you quickly narrow down your search results by suggesting possible matches as you type.
Showing results for
RiccardoEscher
Active Participant
Options
- Subscribe to RSS Feed
- Mark as New
- Mark as Read
- Bookmark
- Subscribe
- Printer Friendly Page
- Report Inappropriate Content
11-03-2010
6:31 AM
A pioneer strands
After years of sermonizing to our system admins to have a look at the features of the Solution Manager one of them finally gets interested into Solution Manager System Monitoring.
Happy to find the first potential admin ally I give him some documentation links, show him the system monitoring work center and also the old SOLUTION_MANAGER transaction and the suitable solution he should use.
Two days later he sits in front of me frustrated that in the Setup System Monitoring screen of that solution the menu entry Edit -> Create Step for Check is grayed out.

He then shows me another (obsolete) solution where this menu entry is active(!).
I am puzzled. Why is this so? I search for some sort of settings in the transaction itself, in the solution, in the SMSY_SETUP, in the Expert Settings of SMSY_SETUP: Nothing.
I start the wonderful new xsearch but I don't find any peace of text touching on this situation.
No chance to convince my brave admin to use the "User Defined Alerts" which are offered for any application server. He is determined to add checks to the tree (for example an SM51 check at the beginning) and wants to know why in one solution this is allowed an in the other solution not.
Once upon a time
Little digression:
Once I worked together with a super consultant, who was not one of the ordinary slide flippers. Besides many other things I admired his deep knowledge of the whole status maintenance (SD, CRM), of all the tons of strange buttons, transactions, and so on, and asked him where he found all that documentation. He looked into my eyes like Gary Cooper in High-noon and said: "The hard way. I debugged the whole coding three times!".
I might be a crummy search machine user, but I am a quit good ABAP developer, so I remember that lesson, don't loose time in searching for non existing documentation and begin to dig.
Here comes the cavalry!
No help from SAP Help - the cavalry it's me.
First I notice that there are always three menu items which are active or not, together with the button "Action List": It must be a coded feature. Let's have a look at the menu.
I open the dialog "Menu -> System -> Status":
Now I do a double click on the GUI status DYN200 and I determine the code of the menu entry: CHECK_ACTION:

I press the button of the "Where-used list" and select "In the program":

And so I find in the function group DSVAS_SERV the local method lcl_session_dispatcher->exclude_status where the menu items are switched off:
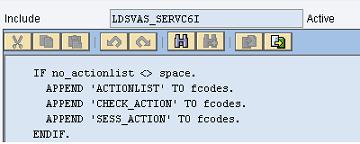
The name of the method sounds convincing. I put an external break-point (see below) and run the transaction: Yes, it is the right place. In our case "no_actionlist" contains 'X'. But why?
I put the cursor on "no_actionlist" and press the lovely "Where-used List" button again and find that in the tapeworm method "new" the value is taken from a memory id:

Damned! The lovely "Where-used List" button will forsake me. What now? Debug the whole program until I find the place where this memory id is filled? It would take days of F5-hitting.
Big Berta will do the job
No chance, I have to take Big Bertha out! I start transaction SE30

Now I create the variant statement_trace. Usually SE30 is taken to find the performance hot spots which need code optimization, so it aggregates the coding. But as I am looking for a single statement, I have to switch off the aggregation. Here my choices for the statements (the more statement you trace, the bigger the trace file):


I indulge in 100 MB file size - do you think they will be enough to trace SOLUTION_MANAGER? 🙂
I start SE30 with the transaction SOLUTION_MANAGER and navigate to the Setup System Monitor (all is really slow now!) and then I leave the setup.
I receive a warning, that the file size was reached! I hope that our memory id is already in the trace file and quit the warning; now I can evaluate the resulting performance data file. The system has to process the giant trace file.
I select Menu -> Utilities -> Dump (perf. file) -> Standard. I have now time enough to view in SM50 the rapidly increasing memory consumption. But our solution manager system is hardened for SOLAR_EVAL Reports and so I don't fear out of memory dumps.

2,5 GB memory plus 2 GB of private memory - not bad! By the way, the shrunk list would be faster consuming less memory, but would not contain the string we are searching for.
Having the list I search now for the string "DSA_ACTIONLIST" which is the first part of the memory id as we have seen in the coding before. And I find it!
Now I press the button "Source code" and here we are!

So Big Berta hit the code (I could also have used a statement breakpoint like I will describe later, but I wanted to show this last solution).
I suppose that our solution manager system administrator would be glad if I now delete the trace file.
By the way, the second part of the memory id is the session number which can also be found in the Setup System Monitoring Menu -> Goto -> Technical information. SM is the session type and 090 the actual client. You can also open the Setup using transaction DSA with the session number.
An inveterate foe
I use the "Where-used List" button and discover that RDSVAS_GEN_INCLUDE is included by an overwhelming amount of programs; I try to put an external breakpoint and receive a similar crowd of programs to select one of. Which one should I choose?
I deleted already the trace file, so temerariously I press the "Select all" button, but I receive the message "You cannot set more than 30 breakpoints".
OK, you are an inveterate foe, but I will get you!
I start the transaction SOLUTION_MANAGER which opens the last screen with the System Monitoring Administration of our solution. I enter the famous hex "/h" into the OK-Code and click on the "Setup System Monitoring" link on the left.
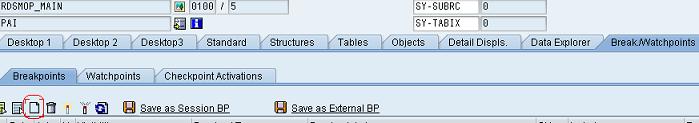
I am in the debugger now, my second home, my documentation library. First I open the Tab "Break./Watchpoints" to delete the useless breakpoints, so that I can set new breakpoints during debugging. And I let the journey begin.
I cannot determine the main program where the form switch_of_actionlist is called, but fortunately the statement which makes a search so difficult is also a seldom used one. So I select the tab for Breakpoints:
and create an ABAP command breakpoint:

Now I can relax and press F8! After some time the debugger pops up: This is the place where our memory id is set: during the processing of function module DSVAS_PROC_SESSION_OPEN:

I select the Tab "Desktop 2" to climb up the ABAP stack and find that the decision to deactivate the action list is performed in the method EXECUTE by dynamically choosing the form routine action_027(RDSVASASOLMON_CUST_________027):

By navigating to the source code (Menu -> Goto -> Goto source code; also as a button in the stack window) I determine the local class name lcl_action_sequence.
Some more comfort
Little digression:
I realize that it is clumsy to always start my debugging with SOLUTION_MANAGER. So I prepare a smarter starting point. First I look in the ABAP stack for a function module which has only few and persistent import parameters (tab Desktop 1 -> Local). I choose DSVAS_SERV_SESSION_OPEN:

I point the cursor at one of the local variables and press the Tool-Service Button:

I save the actual data as test data for the SE37 transaction. So when I want to do a second debug session I can start directly via SE37 the function module DSVAS_SERV_SESSION_OPEN -> Test/Execute -> Button "Test Data Directory", which is really faster than starting via SOLUTION_MANAGER!
Just as a hint, there are some more interesting debugging tools hidden behind the "New tool" button of one of the "Variables" tabs:

If you like your new tools, you might also save your new layout by pressing on the button "Layout".
Understanding the problem
I make a paragon with the (obsolete) solution which does activate the action list menu entries. Not surprisingly the export to memory breakpoint does not fire (which means that the memory id will never be "<> space").
So I have to insert a normal breakpoint to stop at the crucial step:

The program stops as expected and I determine that lf_form_name is still = 'ACTION_027' but this time the main program is 'RDSVASASOLMON_CUST_________018'.
So I must find the place where PROGRAM is set. It's not a local and not a global variable. I suspect that it is a class attribute (the debugger doesn't reveal it). So I insert "ME" as a variable and double click upon it, the debugger opens the tab "Objects" with the reference "ME" and yes, program is an attribute of the local class lcl_action_sequence.
Some tests with a watchpoint "PROGRAM" or "ME->PROGRAM" were not successful, the rules of this tool are too tight, so I open the local class definition in the editor, mark the attribute "PROGRAM" and press the lovely "Where-Used List" button. I get a list of hits; I find two places where the attribute might get his value: lcl_action_sequece->new (Include LDSVAS_PROCCD0) where "PROGRAM" is chosen by a call to the function module DSVAS_CDMNT_CONTAINER_NAME and lcl_action_sequence->load, where the value is read from the database.
I set two external breakpoints at these places so that I can debug normally this call. One example:

and I restart in SE37 the function module DSVAS_SERV_SESSION_OPEN.
It's the second place, the name of the program is taken (Method ->restore) from the database dsvasresultsgen(as).
So I have found that the program name (and thus the disactivation of the menu entries) is an integral part of the system monitoring session of my solution.
Indeed, when I take a closer look at the technical information of both sessions I notice that the session which allows to edit the action list has the "Check Group SOLMON_CUST Version 18" while the session which annoys us has the "Check Group SOLMON_CUST Version 27".
A brief look at the attributes of both programs shows that _018 seems to belong to "ST-SER Release 2005_1" while _027 seems to belong to "ST-SER Release 2008_2". This is really funny because both solutions where created in 2006.
Our first impession was true: The disactivation of the menu entries seems to be a feature. We take a brief look at the transaction DSADEV Service Development Workbench. Yes, we can open the CheckGroup Version 27 (actual is 28) and have a look. We find also a Tab "Compile Report", so our suspicion that the above mentioned reports were machine generated comes true.
When we open in the "CheckGroup Version 027" the tree "Actions" we find the action "027 Initialize SALR". Double clicking upon this action we jump into the already mentioned form routine action_027(RDSVASASOLMON_CUST_________027) which calls switch_of_actionlist.
Result
We have found the reason for the difference in behavior of both solutions - it seems to be a feature. But we didn't find the motivation of this difference: Why should the action list be switched off?
This question cannot be answered with the debugger.
May be one of you has an answer ...
Related Content
- S/4 HANA Cloud Public2402: How to enhance "Item data" within the "repair order" app in the launchpad in Enterprise Resource Planning Q&A
- SAP Sales and Service Cloud / Cloud for Customer – 2405 Release Briefing Webcast in CRM and CX Blogs by SAP
- SAP Sales and Service Cloud – 2402 Release Briefing Webcast in CRM and CX Blogs by SAP
- 401 errors and AppRouter in Technology Blogs by SAP
- Licensing Crystal server for Crystal reports concurrent licensing model in Technology Q&A