
- SAP Community
- Groups
- Interest Groups
- Application Development
- Blog Posts
- ST12 – Who calls whom (get the call stack with bot...
Application Development Blog Posts
Learn and share on deeper, cross technology development topics such as integration and connectivity, automation, cloud extensibility, developing at scale, and security.
Turn on suggestions
Auto-suggest helps you quickly narrow down your search results by suggesting possible matches as you type.
Showing results for
former_member19
Active Contributor
Options
- Subscribe to RSS Feed
- Mark as New
- Mark as Read
- Bookmark
- Subscribe
- Printer Friendly Page
- Report Inappropriate Content
08-23-2010
2:25 AM
Before you start:
If you are not familiar with ST12, please read this blog first:
Single Transaction Analysis (ST12) – getting started
Who calls whom?
Have you ever had this situation? You took a SQL Trace with ST05 or a trace with the aggregation by calling position option with SE30 or ST12 and the majority of the time is spent on the database (nr. 1 in figure 1). One of the most expensive statements is a SELECT statement which was executed very often and maybe identically (nr. 2 and nr. 3 in figure 1). Showing the calling position of the SQL statement navigates you to a SAP function module (nr. 4 in figure 1).
This situation can be seen on the following figure:

Figure 1: Expensive SQL from standard function module.
Now what?
Wouldn't it be nice to find out the call hierarchy above that calls this function module, that drives the number of the statements and that sets the variables for the SQL statement?
With ST12 this is easy to do.
All we have to do is to put the cursor on the line for which we want to get the call stack (nr. 5 in figure 2). Then we click on the so called "Bottom up Analysis" (nr. 6 in figure 2) and after that on "Only CallHier" which appears in the icon bar. The result is a List with calls that are linked with arrows on an orange background color (see lower screen shot on figure 2).
![]()
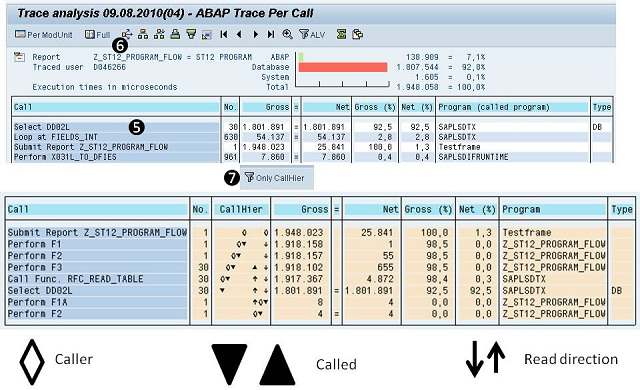
Figure 2: Get the call stack for a call.
Reading this output is something it needs getting used to. Let me explain how to read the output with the example in figure 2.
The top line is the submit report where we can find two icons that look like a diamond with a black outline and no filling. This indicates that this line is a "CALLER". We have 2 icons so we have to follow both of them.
Let's start with the left one. Form F1 has a black triangle which seems to be connected with the diamond in the line above. This means Form F1 is called by the main program. The black triangle means this line has been called. At the same time this line is a caller (diamond) which calls the line below (Form F2). Form F2 is called by Form F1. Form F2 calls Form F3 and Form F3 calls the function module RFC_READ_TABLE. This function module finally calls our expensive SELECT on DD02L. By the way, the No. column shows how often a call was executed.
Now let's follow the second stream:
The main program does not only call Form F1 but Form F1A as well. Here we have to follow the arrows starting at the diamond. The arrows indicate the read direction. The next black rectangle is Form F1A. This means the main program calls F1A. Form F1A calls F2 and F2 calls F3. F2 appears 2 times because the call of F2 is done at 2 different call positions (the trace was done with the aggregation by call position option). Following the arrows from F2 we can see that F2 calls F3 what we have seen already in the first call stack. F3 calls the function module which is executes the identical SELECTs.
So, we have two POSSIBLE call stacks which drive the number of selects and the identical calls. Since we aggregate by call position and each call knows by whom it was called we can reconstruct the POSSIBLE call stack which is not necessarily the real, executed call stack.
Looking at the source code below, we can see that within Form F2, the Form F3 is only called when F2 was called from Form F1 but not when called from F1A. However F3 is called from F2 and F2 is called from F1A (that's the information from the raw trace), that's why 2 possible call stacks are constructed while only one of them was really executed. From the ST12 output we don't know which call stack drives the number of calls but we DO know that one of them is the driver.
What we do know for sure are the one-up hierarchy relations. But in cases where several flows merge into one and/or then separate again we do not know for sure anymore. However, usually we look for issues with large gross time, and there are normally not many possible ways how a large gross time can have flown through the above hierarchy (compare the gross times for F1, F1A, and the two F2s). Therefore the hierarchies are often quite accurate and helpful to understand the problem.
This is the program that was used to get the output above:
REPORT z_st12_program_flow.
DATA: flag_go_on TYPE c.
PERFORM f1.
PERFORM f1a.
FORM f1.
flag_go_on = 'X'.
PERFORM f2 USING flag_go_on.
ENDFORM. "f1
FORM f1a.
flag_go_on = ' '.
PERFORM f2 USING flag_go_on.
ENDFORM. "f1a
FORM f2 USING p_flag_go_on.
IF p_flag_go_on = 'X'.
do 30 times.
PERFORM f3.
enddo.
ENDIF.
ENDFORM. " F2
FORM f3 .
DATA options LIKE STANDARD TABLE OF rfc_db_opt WITH HEADER LINE.
DATA fields LIKE STANDARD TABLE OF rfc_db_fld WITH HEADER LINE.
DATA it LIKE STANDARD TABLE OF tab512 WITH HEADER LINE.
options = `as4time = '140515'`.
append options.
CALL FUNCTION 'RFC_READ_TABLE'
EXPORTING
query_table = 'DD02L'
delimiter = ','
TABLES
data = it
OPTIONS = options
fields = fields
EXCEPTIONS
table_not_available = 1
table_without_data = 2
option_not_valid = 3
field_not_valid = 4
not_authorized = 5
data_buffer_exceeded = 6
OTHERS = 7.
ENDFORM. " F3
Summary:
The Bottom up Analysis in ST12 is a great option that helps us to find out who might drive an expensive and or identical SQL statement. It can help in functional analysis (e.g. where is a message called) as well. In performance analysis it is often used when not a call itself is the problem but the number of calls or how the calls are executed (identical, in a loop, ...).
More information on ST12 can be found here:
ST12 WIKI:
http://wiki.sdn.sap.com/wiki/display/ABAP/Single+Transaction+Analysis
Books:- SAP Managed Tags:
- ABAP Testing and Analysis
1 Comment
You must be a registered user to add a comment. If you've already registered, sign in. Otherwise, register and sign in.
Labels in this area
-
A Dynamic Memory Allocation Tool
1 -
ABAP
8 -
abap cds
1 -
ABAP CDS Views
14 -
ABAP class
1 -
ABAP Cloud
1 -
ABAP Development
4 -
ABAP in Eclipse
1 -
ABAP Keyword Documentation
2 -
ABAP OOABAP
2 -
ABAP Programming
1 -
abap technical
1 -
ABAP test cockpit
7 -
ABAP test cokpit
1 -
ADT
1 -
Advanced Event Mesh
1 -
AEM
1 -
AI
1 -
API and Integration
1 -
APIs
8 -
APIs ABAP
1 -
App Dev and Integration
1 -
Application Development
2 -
application job
1 -
archivelinks
1 -
Automation
4 -
BTP
1 -
CAP
1 -
CAPM
1 -
Career Development
3 -
CL_GUI_FRONTEND_SERVICES
1 -
CL_SALV_TABLE
1 -
Cloud Extensibility
8 -
Cloud Native
7 -
Cloud Platform Integration
1 -
CloudEvents
2 -
CMIS
1 -
Connection
1 -
container
1 -
Debugging
2 -
Developer extensibility
1 -
Developing at Scale
4 -
DMS
1 -
dynamic logpoints
1 -
Eclipse ADT ABAP Development Tools
1 -
EDA
1 -
Event Mesh
1 -
Expert
1 -
Field Symbols in ABAP
1 -
Fiori
1 -
Fiori App Extension
1 -
Forms & Templates
1 -
General
1 -
Getting Started
1 -
IBM watsonx
1 -
Integration & Connectivity
10 -
Introduction
1 -
JavaScripts used by Adobe Forms
1 -
joule
1 -
NodeJS
1 -
ODATA
3 -
OOABAP
3 -
Outbound queue
1 -
Product Updates
1 -
Programming Models
13 -
Restful webservices Using POST MAN
1 -
RFC
1 -
RFFOEDI1
1 -
SAP BAS
1 -
SAP BTP
1 -
SAP Build
1 -
SAP Build apps
1 -
SAP Build CodeJam
1 -
SAP CodeTalk
1 -
SAP Odata
1 -
SAP UI5
1 -
SAP UI5 Custom Library
1 -
SAPEnhancements
1 -
SapMachine
1 -
security
3 -
text editor
1 -
Tools
17 -
User Experience
5
Top kudoed authors
| User | Count |
|---|---|
| 5 | |
| 3 | |
| 2 | |
| 2 | |
| 2 | |
| 2 | |
| 2 | |
| 1 | |
| 1 |