
- SAP Community
- Products and Technology
- Enterprise Resource Planning
- ERP Blogs by Members
- SAP BI solution for Fill rate and Cycle time repor...
Enterprise Resource Planning Blogs by Members
Gain new perspectives and knowledge about enterprise resource planning in blog posts from community members. Share your own comments and ERP insights today!
Turn on suggestions
Auto-suggest helps you quickly narrow down your search results by suggesting possible matches as you type.
Showing results for
Former Member
Options
- Subscribe to RSS Feed
- Mark as New
- Mark as Read
- Bookmark
- Subscribe
- Printer Friendly Page
- Report Inappropriate Content
01-21-2010
4:20 AM
SAP BI solution for Fill rate and Cycle time reporting
Summary: This document discusses a SAP Business Intelligence (BI) data model that can be used for generating fill rate and cycle time reporting using standard data sources from sales and distribution stream. The data model is generic in nature and makes use of ABAP transformations which can be modified to align with any specific business process flow.
Fill rate is used to measure the service level for sales orders placed at an organization against the expectations of organization's trading partners. It can be used to track the cause of delay in order fulfillment. It can be used to capture the effectiveness of
- Inventory management
- Distribution centers
Through fill rate reporting (Figure 1), delay in order processing can be attributed to reasons like
- Inventory shortfall
- Shipment shortfall

Figure 1 Sample of Fill rate report
Fill rate can be measured in different ways.
- Line count fill rate
- Qty fill rate
- Value fill rate
Closely related to fill rate is another analysis criteria known as cycle time reporting (Figure 2). If fill rate is analyzing the performance of supply chain in terms of ‘quantity', then the ‘time' parameter is covered through cycle time reporting.
Cycle time can be defined as the amount of time required to complete the Order to Cash process from order receipt to processing, order processing to ship, ship to delivery.
- Order receipt to processing: difference between delivery date and customer Purchase Order (PO) date
- Order processing to ship: difference between actual goods issue (GI) date and delivery date
- Order receipt to delivery: difference between EDI date and actual GI date
- Order processing to delivery receipt: difference between EDI date (ED1 214) and customer PO date

Figure 2 Sample of Cycle time report
EDI 214 is used by a transportation carrier to provide shippers, consignees, and their agents with the status of shipments, dates, times, locations, route, identifying numbers, as well as information concerning shipments in transit. This data when integrated with the sales and delivery data from ECC provides a complete snapshot of the entire transaction and helps the organization to assess the performance of its supply chain with a customer focused approach.
| Break up of Order processing time frame |

Depending on the business process, cycle time can be used as a measure both for internal processing and customer satisfaction. When used as customer facing attribute, the measurement criteria would be delivered on time. For internal analysis, the criteria could be shipped on time.
Approach for BI data model
Depending on specific business requirements and scenarios there could be multiple ways to approach the solution. Below I have discussed a data model that was successfully deployed at multiple clients ranging from a manufacturer of medical supplies to consumer goods division of a pharmaceutical major. The recommended approach makes use of ABAP transformations that provide the necessary flexibility to introduce logic that is typical of a industry.
The data model (Figure 3) covers both fill rate and cycle time analysis and makes use of standard business content data extractors for SD along with a custom extractor to bring details of EDI 214 transactions into BI.
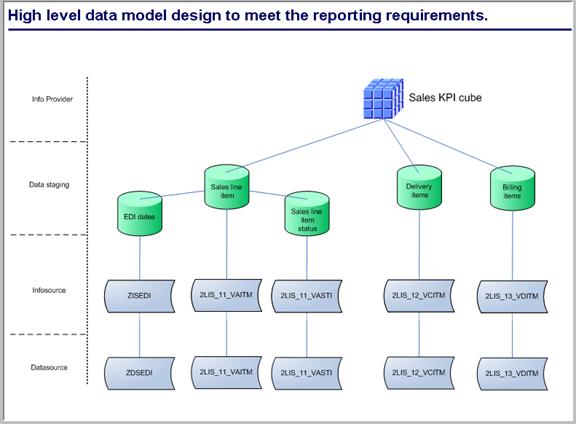
Figure 3 BI Data model including EDI 214
Following data sources are used in the build of the data model
- 2LIS_11_VAITM (Sales Order-Item Data)
It is quite possible that details of EDI 214 are not available for all the shipments. In order to effectively determine the likely date when the goods will be delivered to the customer, VAITM data source is enhanced to include a field to hold the no of days required for customer delivery based on the route information available on the sales order.
- 2LIS_11_VASTI (Sales Document Item Status)
This extractor brings in details of various statuses associated with sales order item
- 2LIS_11_V_SSL (Sales Document Order Delivery)
This extractor brings in details of dates and quantities at the schedule line level. This data is very useful to determine the cause of delay in sales order line item processing.
- 2LIS_12_VCITM (Delivery Item)
- Custom data source for EDI 214 transactions
Data from the above data sources is brought into a staging layer comprising of DSOs and is further loaded into a custom built Sales KPI cube using a series of transformations to achieve fill rate and cycle time reporting.
Custom development for Fill rate reporting
This vertical is used to track the cause of delay in order fulfillment. The cause is attributed either to ‘Inventory shortfall' indicated by ‘I' or ‘Shipment shortfall' indicated by ‘S'. Values ‘I' or ‘S' are stamped on an indicator flag field available in Sales KPI while doing the update from Sales line item DSO.
Data from sales document order delivery stream (2LIS_11_V_SSL) and sales document item status (2LIS_11_VASTI) is merged with the sales order line item DSO. This data is then taken through a transformation before being saved into the Sales KPI cube. The data goes through a comprehensive ABAP routine transformation written to populate the indicator flag field.
The logic for ABAP routine is dependent on client specific business scenario and should be all encompassing. Sample logic is shown below and the same can be enhanced to accommodate variations due to make to stock or make to order strategies.
| Shortfall | Scenario |
| Inventory Shortfall (I) | Order with no confirmed qty or confirmed qty less then requested qty |
| Order Created - Delivery Created - Batch Managed material and no batch assigned to the delivery | |
| Confirmed date on schedule line is greater then the total of customer requested delivery date and days determined from Route information | |
| Confirmed qty not zero, batch managed product and batch information not available | |
| Batch managed product and complete requested qty not delivered | |
| Shipment Shortfall (S) | Delivery created but no PGI done |
| Qty confirmed but no delivery created and current date is greater then planned goods issue date | |
Sample code
* Make To Order scenario
IF COMM_STRUCTURE-/bic/zmrpgrp EQ '0052'.
* Inventory Shortfall
IF COMM_STRUCTURE-/bic/zcnfqt_bm LT COMM_STRUCTURE-/bic/zreqty_bm
AND COMM_STRUCTURE-sched_line EQ '0002'.
RESULT = 'I'.
* Shipment Shortfall
ELSEIF COMM_STRUCTURE-conf_date LT COMM_STRUCTURE-act_gi_dte
AND COMM_STRUCTURE-/bic/zreqty_bm NE COMM_STRUCTURE-dlv_qty_bm.
RESULT = 'S'.
* Delivery past current date - Shipment Shortfall
ELSEIF COMM_STRUCTURE-pld_gi_dte LT sy-datum
AND COMM_STRUCTURE-dlv_sts NE 'C'.
RESULT = 'S'.
ENDIF.
* Make To Stock scenario
ELSE.
* Inventory Shortfall
IF COMM_STRUCTURE-/bic/zcnfqt_bm LT COMM_STRUCTURE-/bic/zreqty_bm
AND COMM_STRUCTURE-sched_line EQ '0001'.
RESULT = 'I'.
* Shipment Shortfall
ELSEIF COMM_STRUCTURE-dsdel_date LT COMM_STRUCTURE-act_gi_dte
AND COMM_STRUCTURE-/bic/zreqty_bm NE COMM_STRUCTURE-dlv_qty_bm.
RESULT = 'S'.
* Delivery past current date - Shipment Shortfall
ELSEIF COMM_STRUCTURE-pld_gi_dte LT sy-datum
AND COMM_STRUCTURE-dlv_sts NE 'C'.
RESULT = 'S'.
ENDIF.
Custom development for Cycle time reporting
Time characteristic 0CALDAY in the KPI cube is updated using Order date coming in from both sales order item DSO and delivery items DSO. This characteristic is then used as the selection parameter while running the BI queries.As the cube is being updated from 2 different data streams, to harmonize everything into one single line for every sales order and item combination all the relevant dates were converted into key figs of type maximum and then included in the cube.

Cycle time calculation is done at the query level with the help of conditions in BEx formula editor.
e.g. Order receipt to processing can be calculated as (in the below calculation if either of Delivery date or Customer PO date is found to be 0, then the no of days is defaulted to 12 based on the client's business requirements)
((DATE (‘Delivery Date')<DATE (‘Customer PO Date')) OR ((COUNT (DATE (‘Delivery Date')) = = 0) AND (COUNT (DATE (‘Customer PO Date')) = = 0))) * 12 + (DATE (‘Delivery Date') > = DATE (‘Customer PO Date')) * (‘Delivery Date' - ‘Customer PO Date')

- SAP Managed Tags:
- SAP Business One
You must be a registered user to add a comment. If you've already registered, sign in. Otherwise, register and sign in.
Labels in this area
-
"mm02"
1 -
A_PurchaseOrderItem additional fields
1 -
ABAP
1 -
ABAP Extensibility
1 -
ACCOSTRATE
1 -
ACDOCP
1 -
Adding your country in SPRO - Project Administration
1 -
Advance Return Management
1 -
AI and RPA in SAP Upgrades
1 -
Approval Workflows
1 -
Ariba
1 -
ARM
1 -
ASN
1 -
Asset Management
1 -
Associations in CDS Views
1 -
auditlog
1 -
Authorization
1 -
Availability date
1 -
Azure Center for SAP Solutions
1 -
AzureSentinel
2 -
Bank
1 -
BAPI_SALESORDER_CREATEFROMDAT2
1 -
BRF+
1 -
BRFPLUS
1 -
Bundled Cloud Services
1 -
business participation
1 -
Business Processes
1 -
CAPM
1 -
Carbon
1 -
Cental Finance
1 -
CFIN
1 -
CFIN Document Splitting
1 -
Cloud ALM
1 -
Cloud Integration
1 -
condition contract management
1 -
Connection - The default connection string cannot be used.
1 -
Custom Table Creation
1 -
Customer Screen in Production Order
1 -
Data Quality Management
1 -
Date required
1 -
Decisions
1 -
desafios4hana
1 -
Developing with SAP Integration Suite
1 -
Direct Outbound Delivery
1 -
DMOVE2S4
1 -
EAM
1 -
EDI
3 -
EDI 850
1 -
EDI 856
1 -
edocument
1 -
EHS Product Structure
1 -
Emergency Access Management
1 -
Energy
1 -
EPC
1 -
Financial Operations
1 -
Find
1 -
FINSSKF
1 -
Fiori
1 -
Flexible Workflow
1 -
Gas
1 -
Gen AI enabled SAP Upgrades
1 -
General
1 -
generate_xlsx_file
1 -
Getting Started
1 -
HomogeneousDMO
1 -
IDOC
2 -
Integration
1 -
Learning Content
2 -
LogicApps
2 -
low touchproject
1 -
Maintenance
1 -
management
1 -
Material creation
1 -
Material Management
1 -
MD04
1 -
MD61
1 -
methodology
1 -
Microsoft
2 -
MicrosoftSentinel
2 -
Migration
1 -
mm purchasing
1 -
MRP
1 -
MS Teams
2 -
MT940
1 -
Newcomer
1 -
Notifications
1 -
Oil
1 -
open connectors
1 -
Order Change Log
1 -
ORDERS
2 -
OSS Note 390635
1 -
outbound delivery
1 -
outsourcing
1 -
PCE
1 -
Permit to Work
1 -
PIR Consumption Mode
1 -
PIR's
1 -
PIRs
1 -
PIRs Consumption
1 -
PIRs Reduction
1 -
Plan Independent Requirement
1 -
Premium Plus
1 -
pricing
1 -
Primavera P6
1 -
Process Excellence
1 -
Process Management
1 -
Process Order Change Log
1 -
Process purchase requisitions
1 -
Product Information
1 -
Production Order Change Log
1 -
purchase order
1 -
Purchase requisition
1 -
Purchasing Lead Time
1 -
Redwood for SAP Job execution Setup
1 -
RISE with SAP
1 -
RisewithSAP
1 -
Rizing
1 -
S4 Cost Center Planning
1 -
S4 HANA
1 -
S4HANA
3 -
Sales and Distribution
1 -
Sales Commission
1 -
sales order
1 -
SAP
2 -
SAP Best Practices
1 -
SAP Build
1 -
SAP Build apps
1 -
SAP Cloud ALM
1 -
SAP Data Quality Management
1 -
SAP Maintenance resource scheduling
2 -
SAP Note 390635
1 -
SAP S4HANA
2 -
SAP S4HANA Cloud private edition
1 -
SAP Upgrade Automation
1 -
SAP WCM
1 -
SAP Work Clearance Management
1 -
Schedule Agreement
1 -
SDM
1 -
security
2 -
Settlement Management
1 -
soar
2 -
Sourcing and Procurement
1 -
SSIS
1 -
SU01
1 -
SUM2.0SP17
1 -
SUMDMO
1 -
Teams
2 -
User Administration
1 -
User Participation
1 -
Utilities
1 -
va01
1 -
vendor
1 -
vl01n
1 -
vl02n
1 -
WCM
1 -
X12 850
1 -
xlsx_file_abap
1 -
YTD|MTD|QTD in CDs views using Date Function
1
- « Previous
- Next »
Related Content
- Jumpstart your cloud ERP journey with guided enablement in RISE with SAP Methodology in Enterprise Resource Planning Blogs by SAP
- 261 Consumption in WM in Enterprise Resource Planning Q&A
- Restriction on number of consolidation units in SAP Group Reporting Public Cloud edition. in Enterprise Resource Planning Q&A
- Revolutionizing Taxation: Navigating VAT in the Digital Age (ViDA) in Enterprise Resource Planning Blogs by SAP
- Portfolio Management – Enhanced Financial Planning integration in Enterprise Resource Planning Blogs by SAP
Top kudoed authors
| User | Count |
|---|---|
| 5 | |
| 2 | |
| 2 | |
| 2 | |
| 2 | |
| 2 | |
| 2 | |
| 1 | |
| 1 | |
| 1 |