
- SAP Community
- Groups
- Interest Groups
- Application Development
- Blog Posts
- Single Transaction Analysis (ST12) – getting start...
Application Development Blog Posts
Learn and share on deeper, cross technology development topics such as integration and connectivity, automation, cloud extensibility, developing at scale, and security.
Turn on suggestions
Auto-suggest helps you quickly narrow down your search results by suggesting possible matches as you type.
Showing results for
former_member19
Active Contributor
Options
- Subscribe to RSS Feed
- Mark as New
- Mark as Read
- Bookmark
- Subscribe
- Printer Friendly Page
- Report Inappropriate Content
09-08-2009
5:06 AM
The Single Transaction Analysis was developed to promote the usage of ABAP trace inside SAP Support. It integrates the ABAP- (SE30) and the Performance (ST05) Trace into one transaction. This blog will show how to take a trace with ST12 in the so called "Current Mode" scenario. Further options for performning traces and analysis will be presented in future blogs.
Before you start:
ST12 is delivered as a part of the Service tools for Applications (ST-A/PI). SAP note 69455 describes how to get the latest version of the ST-A/PI. Note that the ST12 transaction is not officially documented / supported and only available in the English language. Although it is mainly intended for use by SAP or certified service consultants during SAP Service Sessions, you can use it for you own performance analysis. A description of ST12 is given in SAP note 755977 (ST12 "ABAP Trace for SAP EarlyWatch/GoingLive").
ST12 main Screen:
The main screen of ST12 has three main parts as shown on figure 1.

Figure 1: main screen
Using ST12 with Current Mode:
In the "Current Mode" Scenario you are going to trace the execution of a program or transaction. Before you trace, it is recommended to execute your program or transaction several times to fill the buffer and caches, as filling the buffers and caches is something that can't be optimized with ABAP or SQL tuning. Before you can start the trace you have to define the measurement scope. In ST12 this is done "on the fly", no measurement variants are saved. After starting ST12 and clicking on "Current Mode" (see nr. 1 in figure 1) you will see a screen like figure 2.
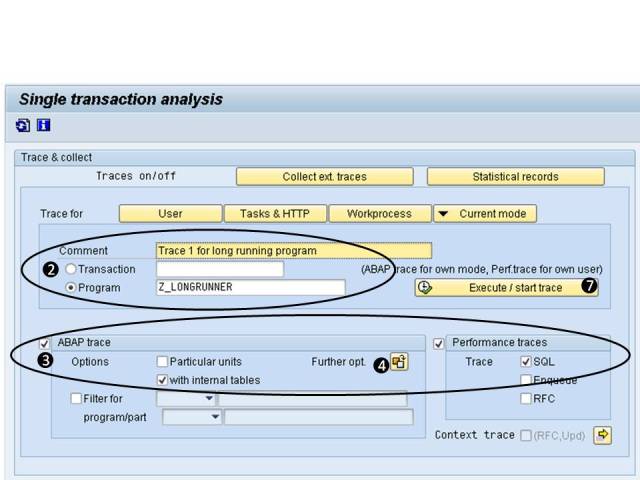
Figure 2: Current Mode
You can enter a comment to give a meaningful description for the trace. Enter your program or transaction in the corresponding field and set the appropriate radio button, see nr. 2 in figure 2. In the lower part of the screen you define the measurement scope. The left part is for the ABAP trace (SE30) and the right part for the Performance Trace (ST05), see nr. 3 in figure 2.
Note: Since ST12 uses the functionality of both transactions (SE30 and ST05) the options are similar or the same. ST12 hides some details to make the traces more easy to use.
For the ABAP trace the most important decision is if you want to trace "with internal tables". It is recommended to switch this setting on. Other options like Particular units, Filters or "Further opt." are only needed in exceptional cases and beyond the scope of this "getting started" blog.
If you click on "Further opt." (see nr. 4 in figure 2) the following screen pops up:

Figure 3: further Options
Increase the "Max. size of file" to 20 MB (see nr. 5 in figure 3) and the "Max. trace runtime" to 3600 seconds (see nr. 6 in figure 3) if you have long running programs. The aggregation is set to "by calling position" by default which is the recommended option. All other options only have to be changed in exceptional cases. For example, if you get strange or negative times in the ABAP traces, you should use the low resolution clock.
For the performance trace you can decide whether you want to take the SQL-, Enqueue- and / or RFC trace. In the above scenario only the SQL Trace is switched on. The SQL Trace is the most important performance trace.
This is all you have to do. You can start your program or transaction now by clicking "Execute / start trace" (see nr. 7 in figure 2). After your program or transaction has finished and you have returned to ST12 you will see your trace in the lower part of the screen.
The status column (see nr. 8 in figure 4) shows you whether your trace is ready for evaluation. There might be a red and white circle which means the ABAP trace is still being imported into the database. The yellow flash indicates a measurement error (e.g. time limit exceeded, file size to small, ...). The green tick shows that the ABAP trace has been successfully imported to the database.
Note that ST12 imports the ABAP trace files into the database, in order to make them available in the whole system and keeps them for later analysis. In SE30 the trace files are application server specific and deleted after a certain number of days. The performance trace is not imported by ST12 and therefore is only available until the trace files are overwritten.
To evaluate the trace you can click on ABAP trace (see left arrow in figure 4) in order to display the imported ABAP trace. The list on figure 3 has been sorted descending by the Net column. This means the total times for each calling position is displayed in descending order.
In order to evaluate the performance traces just click the button Performance traces, see right arrow in figure 4. This will display the basic list of the performance trace. For the SQL trace it is recommended to start with the statement summary. Therefore in the basic list click menu Trace List -> Summary by SQL Statements. In figure 3 on the right bottom you can see an example of the SQL Trace Summary.
Note: Please refer to The SQL Trace (ST05) - Quick and Easy Blog (The SQL Trace (ST05) – Quick and Easy) for further details on ST05 analysis.

Figure 4: Trace Analysis
Summary:
In order to take an ABAP and SQL Trace at the same time for a program you are going to execute the following steps:
- 1.) Call ST12, click on CURRENT MODE (Nr. 1 in figure 1)
- 2.) Fill in the program or transaction and a meaningful comment (Nr. 2 in figure 2)
- 3.) Define the measurement variant:
- a. switch on ABAP and SQL Trace and use internal tables (Nr. 3 in figure 3)
- b. increase the file size and the duration (Nr. 4 in figure 2 and Nr. 5 and 6 in figure 3)
- 4.) Execute your program (Nr. 7 in figure 2)
- 5.) Evaluate the trace (figure 5)
This blog demonstrated how ST12 combines the ABAP and Performance trace and how easy it is to trace a program and measure both ABAP and SQL execution. Future blogs will show advanced topics for trace taking and analysis.
More information on ST12 can be found here:
ST12 WIKI:
http://wiki.sdn.sap.com/wiki/display/ABAP/Single+Transaction+Analysis
Blogs:
Books:
- SAP Managed Tags:
- ABAP Testing and Analysis
5 Comments
You must be a registered user to add a comment. If you've already registered, sign in. Otherwise, register and sign in.
Labels in this area
-
A Dynamic Memory Allocation Tool
1 -
ABAP
8 -
abap cds
1 -
ABAP CDS Views
14 -
ABAP class
1 -
ABAP Cloud
1 -
ABAP Development
4 -
ABAP in Eclipse
1 -
ABAP Keyword Documentation
2 -
ABAP OOABAP
2 -
ABAP Programming
1 -
abap technical
1 -
ABAP test cockpit
7 -
ABAP test cokpit
1 -
ADT
1 -
Advanced Event Mesh
1 -
AEM
1 -
AI
1 -
API and Integration
1 -
APIs
8 -
APIs ABAP
1 -
App Dev and Integration
1 -
Application Development
2 -
application job
1 -
archivelinks
1 -
Automation
4 -
BTP
1 -
CAP
1 -
CAPM
1 -
Career Development
3 -
CL_GUI_FRONTEND_SERVICES
1 -
CL_SALV_TABLE
1 -
Cloud Extensibility
8 -
Cloud Native
7 -
Cloud Platform Integration
1 -
CloudEvents
2 -
CMIS
1 -
Connection
1 -
container
1 -
Debugging
2 -
Developer extensibility
1 -
Developing at Scale
4 -
DMS
1 -
dynamic logpoints
1 -
Eclipse ADT ABAP Development Tools
1 -
EDA
1 -
Event Mesh
1 -
Expert
1 -
Field Symbols in ABAP
1 -
Fiori
1 -
Fiori App Extension
1 -
Forms & Templates
1 -
General
1 -
Getting Started
1 -
IBM watsonx
1 -
Integration & Connectivity
10 -
Introduction
1 -
JavaScripts used by Adobe Forms
1 -
joule
1 -
NodeJS
1 -
ODATA
3 -
OOABAP
3 -
Outbound queue
1 -
Product Updates
1 -
Programming Models
13 -
Restful webservices Using POST MAN
1 -
RFC
1 -
RFFOEDI1
1 -
SAP BAS
1 -
SAP BTP
1 -
SAP Build
1 -
SAP Build apps
1 -
SAP Build CodeJam
1 -
SAP CodeTalk
1 -
SAP Odata
1 -
SAP UI5
1 -
SAP UI5 Custom Library
1 -
SAPEnhancements
1 -
SapMachine
1 -
security
3 -
text editor
1 -
Tools
17 -
User Experience
5
Top kudoed authors
| User | Count |
|---|---|
| 3 | |
| 3 | |
| 3 | |
| 2 | |
| 2 | |
| 2 | |
| 2 | |
| 1 | |
| 1 | |
| 1 |