SAP Internet Transaction Server (ITS) is a middlerware component that provides access to several SAP products (E.g. SRM, CRM, ESS etc. ) through web browser. There are two types of Internet Transaction Servers. Before SAP NW 04 (SAP Web AS 6.40) ITS was available as standalone engine, called as External ITS. With SAP NW 04 (SAP Web AS 6.40), ITS has been integrated into the SAP Net Weaver component as an Internet Communication Framework (ICF) service. Therefore, the debugging techniques differ for both of these ITS servers.
This blog talks about the techniques that one can use when faced with the task of debugging an ITS application - both externally as well as internally. Also provided, is some help on ITS server debugging.<u>!https://weblogs.sdn.sap.com/weblogs/images/251807116/IMG4.JPG|height=1|alt=|width=1|src=https://webl...!</u>
<u>External ITS server Debugging:</u>
When there is a need to understand exactly how the ITS application functions in SAP, you can follow the steps given below to make things a little quicker and easier.
-> Enable the ITS Debugger</p><ol><li>Log on to ITS Admin Service through web browser and click on: </li><li>Configuration->Registry->Programs->Agate->SapguiDebuggerEnabled</li><li>Change the "New Value" to 1.</li><li>Click the Save Button</li><li>The ITS service should be restarted for the change to take effect.</li><li>Open SAP Logon window and create a new entry for the virtual ITS application server. </li></ol><p> To do this, enter the following information.</p><p> Description : <Any description></p><p> Application Server : IP address of AGATE host</p><p> System Number : ‘00' by default. OR Debugging Port Key defined in </p><p> ITS ADM. This can be found under Configuration->Debug</p><p>-> Starting ITS Debugging session.
At the same time open the SAP Logon and double click on the entry for virtual ITS application.
This will open the SAP transaction corresponding to the ITS service in SAPGUI.
Start the debugger by entering /h in the SAPGUI command field.
<u>Integrated ITS server debugging:</u>
-> Find out Internet Service Name from the webpage you want to debug.
1. Internet service name can be found out from the HTML source of the webpage you want to debug.
2. You can view the HTML source code by right clicking the webpage and selecting option "View Source".
3. Search for the word "template" in the HTML source code of the webpage.
4. This template tag would be as follows:
5.
Template = ZBBPSC07/99/saplzbbp_sc_ui_its_1000.html0.1.
Here ZBBPSC07 is the internet service name, and saplzbbp_sc_ui_its_1000.html is the HTML template name.0.1. There could be more than one templates embedded in single webpage.
In such case one may follow the below steps:
- Look for the webpage section that you want to debug. For example you want to debug "Approval Preview" section of Shopping Cart webpage as shown below.

- Locate this section in HTML source code.
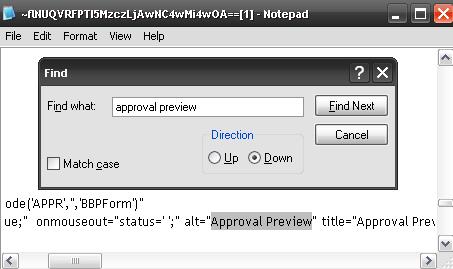
- Search for word "template" in upward direction in HTML source code.
!https://weblogs.sdn.sap.com/weblogs/images/251807116/IMG3.JPG|height=1|alt=|width=1|src=https://webl...!
-> Enable HTTP debugging.
1. Execute transaction SICF.
2. Navigate to the internet service for which you want to enable debugging.
3. Go to Edit->Debugging->Activate Debugging.

4. Enter the user id of the user with which you will log into the web application and click on "Activate".

5. In the ABAP workbench/ABAP Editor, go to Utilities->Settings->Debugging

6. Mark checkbox ‘Act Debugging'.
7. Enter the user id for which you want to enable ITS debugging.
8. Check the checkbox ‘IP Matching' & click OK.
-> Put HTTP breakpoint.
1. Go to transaction SE80 and open the internet service you identified in step 1.
2. Navigate to the HTML template identified in step 1.
3. Name of the HTML template gives you the name and screen number of the main module pool program that contains the business logic.
For example, HTML Template Name: saplzbbp_sc_ui_its_1000.html can be decoded as
Module Pool Program : SAPLZBBP_SC_UI_ITS
Screen No : 1000
4. Open the program in SE38 and click on to open ABAP workbench object navigator.
5. Locate the screen and read through the PBO and PAI code.
6. Identify the statement you want to put the breakpoint at and click on !https://weblogs.sdn.sap.com/weblogs/images/251807116/IMG9.JPG|height=24|alt=|width=23|src=https://we...!.
7. This will display the below message.

8. Click on HTTP Breakpoint
9. This will put HTTP breakpoint at that statement.
!https://weblogs.sdn.sap.com/weblogs/images/251807116/IMG8.JPG|height=29|alt=|width=268|src=https://w...!</body>
