Live Dashboard Links:
http://www.geocities.com/jkurgan/EarthQuakes-DataGov.swf
http://sites.google.com/site/jkurgan/EarthQuakes-DataGov.swf
With the advent of data.gov, more public information is available to us than ever before. This data is also available to us in easily discernable formats such as CSV, XML, and a short list of others. While many sites allow you to access or download data to your desktop, not many allow you to connect to this information live from other web servers

As an example, you can certainly get an XML feed from a Google Spreadsheet, but you won't be able to publish a live dashboard on a webserver and use that live data feed unless you are doing some custom coding or scripting. Even if you have the XcelsiusWeb Add-on that has a Google Document connector, you still wont be able to publish a SWF file that pulls data from a Google Spreadsheet directly. Google allows you to create Google widgets that use that data, but they haven't fully opened their doors to usage of the underlying data by the means we intend to use. The barrier blocking access to the data is a restrictive crossdomain.xml policy that only allows Google domains to use that information.
The nice thing about data.gov is these limitations do not apply. A few other sites, such as Yahoo also have more open policies with data they host. Since this government data is open to all, we can go ahead and create a live dashboard that will continously refresh itself with the lastest information.
In the interest of keeping this blog posting short, I'll just give a high level overview of how I built the above dashboards. The first thing I did was goto data.gov and search for information available in XML format. I also wanted information that got refreshed on a frequent basis, so that the 'live' feature of the dashboard was apparent.
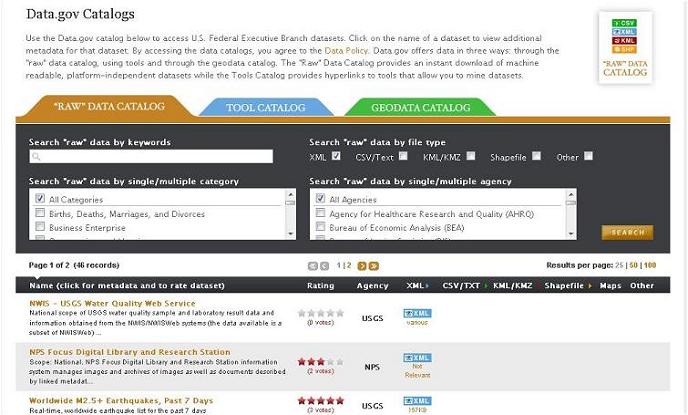
After a quick search, I found a feed that had lastest geological data for earthquakes over 2.5 magnitude in the last week. I right clicked on the XML icon and copied that URL shortcut to my clipboard.
In Excel (not Xcelsius), I imported the XML feed using the URL, which then creates an XML map. In the Xcelsius Data Manager, I re-inputted that URL as an XML Map connection. This builds the connection between the dashboard and the data feed inputted into Excel. There are plenty of examples on how to do this, just search SDN or the web.
Building the dashboard, I used the Xglobe component from the Xcomponents Add-On package and told the component to look at the XML field that stored the Latitude and Longitude information. From there, I was able to get the data to plot out nicely on the globe.
While I did have numerous issues with Xcelsius or Excel crashing, I was able to get this up and running. I had plans for simple modifications to include more information when you click on the locations, but Xcelsius was not complying with me so I just left this dashboard in a very generic state (sorry). But hopefully the lack of bells and whistles will allow you to focus on what was accomplished.
