Review
In a prior blog, I talked about Oracle index compression and how database performance on one system improved around the time compression was done, and on another system performance was unchanged. Time has gone by.
In that story I said: "The drop begins that week, which is a little strange, as it should have begun after that week, but the daily values are lost in the aggregate." If you parse that sentence, you will understand that the purported cause occurred before the perceived effect. In root cause analysis, that is impossible. And as the fictitious Sherlock Holmes is famously quoted as having said "...eliminate the impossible...".
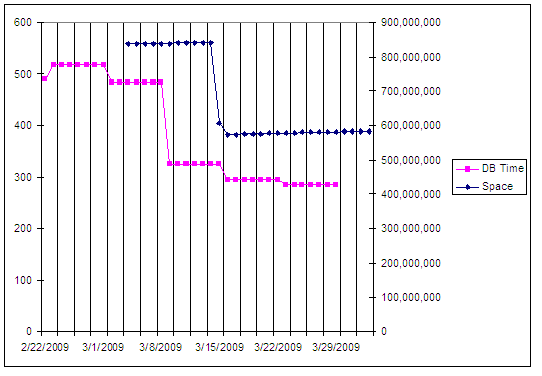
The above chart shows index space values, which are recorded on a daily basis, plotted with database response time values, shown here on a weekly basis. ST03 aggregates these data on daily, weekly and monthly intervals. I've stretched the response times back through the weekly period, so you can more clearly see the time split between the 2 metrics.
Improbable
Now that we have eliminated index compression as the root cause for our database performance improvement, what other possibilities exist? The choices might include hardware changes, database patches, parameter alterations, or code changes. Of these, the most notable are:
- Database patching from Oracle 10.2.0.2 to 10.2.0.4 in February
- Parameter changes from February onward
Database Patch
Oracle took a while to certify 10.2.0.4 with SAP, and they skipped over the 10.2.0.3 patchset. Though our systems were stable on 10.2.0.2, the next level fixed a couple of nagging issues, and whenever new issues might arise, we wanted to be able to answer the "are you on the latest patchset" question affirmatively. Our testing of 10.2.0.4 found changes to SQL statement optimization, not all to the better, meaning we took our time rolling this into production. Once it got there, and real users threw real work at it, the serious on-the-job tuning began.
I grabbed performance history data from ST04, looking at the various columns for patterns. One clear difference was in the number of full table scans before and after the database patch.

If you are familiar with this transaction, you will understand that the values accumulate until the database is restarted. Other than the week of March 15th, we bounced the database weekly. Why did the number of full table scans increase? Without going into detail on database statistics, SQL cache analysis and tuning methods, the short answer is serious logic changes to the database optimizer.
If you are not familiar with the performance history part of ST04, it has these components, accessible with the [More] button.
- Oracle call statistics
- Oracle request statistics
- Oracle system statistics
You should find full table scan values in the last column of the last screen.
At this point you might be asking, "are full table scans good or bad?" And my answer would be "it probably doesn't matter that much." The problem at hand is "what happened on or about March 8th" and full table scans did not not cause the performance shift, as the scan change started a month earlier.
We can eliminate the 10.2.0.4 patchset, along with its little patchlets (just a couple dozen critical, security, and merge fixes) as impossible. What is left?
Database parameter
If I hadn't simply asked the lead DBA what changed on 08-Mar, I might have looked at the parameter history values under ST04. I especially like these data, as they persist across most system changes, including hardware platforms, patches and SAP code changes.
This is the prime suspect for influencing database response time. It had the means (it alters cost-based optimizer SQL plans system-wide) and it had opportunity (the time lines up). What about motivation? Um, that would be us.
| Parameter | Date | Value |
|---|
| OPTIMIZER_DYNAMIC_SAMPLING | 03/07/09 | 5 |
| | 02/07/09 | 6 |
| | 05/11/08 | 2 |
| | 05/14/07 | 1 |
If you are following the chronology, the parameter went from 1 to 2 when we upgraded to 10.2.0.2, then from 2 to 6 when we patched to 10.2.0.4, and on 07-Mar-2009, was set to 5. We changed it to 5 because certain SQL plans were suboptimal with 6. I'm not recommending any specific change to anyone else, only explaining what we did.
When I searched SCN for the keyword "optimizer_dynamic_sampling" I only found 2 hits. One is not helpful; the other is extremely helpful:
Oracle Cost Based Optimizer (CBO) and its Optimism about Cardinalities: Typical Problem Situations by Martin Frauendorfer
In his presentation, Martin dives deep into changes in optimizer behavior, explaining "simplified column group statistics" and "increased dynamic sampling" far better than I can.

The last screen shot shows one attempt I made to find statements that act differently with different values of the parameter. You can change the SQL plan explanation using different settings, by choosing "alter session." I tried out a few statements with joins, but was unable to find a clear example to demonstrate the impact of this parameter. I'll keep looking, or set a trap.
Questions
In the prior blog, a number of questions came up about index compression, which was my first theory for the root cause. Given I have abandoned that theory, I won't answer those here.
