Previously:
Episode 1 |Episode 2 | Episode 3
When we left this saga last episode, the DBA squad had built an air-tight case for a new index on a CO-PA table, with preliminary results in the QA system showing the performance improvements that should tip the average transaction time back into the black. This chapter is an abbreviated look, a pulp short story if you will, of the results for the past week.
Detective's Log, Friday Dec. 12, 2008 3:00 PM (EST)
I looked into the production system to see what had happened with the index build, and the results, if visible. I saw the new index was online, and had statistics created as of the evening before.
SQL> select
  to_char(last_analyzed, 'DD-Mon-YYYY HH24:MI')
from
  dba_tables
where
  table_name like 'CE4%';
TO_CHAR(LAST_ANALYZED,'
-----------------------
11-Dec-2008 19:26
I decided to skip showing the SQL cache for that period, as I wasn't sure if all of the data from prior to the new index had been invalidated. I would have said yes, as soon as the object was changed the cache was cleared, but the first load time showed:
2008-12-07/11:32:41
It will be clearer to show the values recorded after the next database bounce.
Detective's Log, Saturday Dec. 13, 2008 9:00 AM (EST)
While there was a little data for Thursday and early Friday, showing how the database behaved with the new index, I waited until Saturday morning to get a full 24-hour shift of transactions. Given relatively few of these occur on Saturday or Sunday, I've omitted these out of the chart below.
Average Response Time - VL02
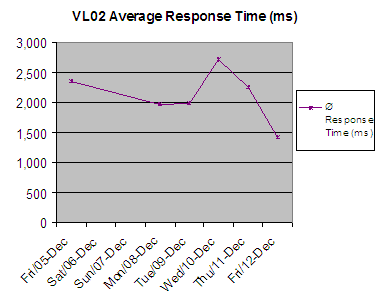
Previous days this month had average times between 2.0 and 3.0 seconds, consistent with the past several months, as related in Episode 1. Friday shows a dramatic decline to under 1.5 seconds. The workload on 12-Dec-2008 was on the same magnitude as the week prior, 05-Dec-2008.
The next chart shows the breakdown of CPU and database time, typically the vast majority of total response time. You can see the database time drops, while the CPU time stays level.
Database and CPU time - VL02

Will this trend continue into the future? I'm fairly confident, but we'll remain vigilant.
Detective's Log, Sunday Dec. 14, 2008 2:00 PM (EST)
I took a look at the SQL cache after the database restart on Sunday, and found the "After" line below. I've repeated the "Before" line from Episode 3.
| When | Disk reads | Reads /Exec | Buffer gets | Bgets /exec | Proc. rows | Rproc /Exe | Bgets /row | Program name |
|---|
| Before | 785,249 | 41.4 | 5,805,240 | 306 | 13,873 | 0.7 | 418.5 | RK2Axxxx_POST |
| After | 9,633 | 4.8 | 31,155 | 15 | 1,594 | 0.8 | 19.5 | RK2Axxxx_POST |
Transport logs (partial)

I think this is the end.
Addendum
Original SQL trace
| Duration | Obj. name | Op. | Recs. | RC | Statement |
| 5 | CE4____ | REOPEN | | 0 | SELECT WHERE "MANDT" = '999' AND "AKTBO" = 'X' ... |
| 1,747,370 | CE4____ | FETCH | 0 | 1403 | |
| 4 | CE4____ | REOPEN | | 0 | SELECT WHERE "MANDT" = '999' AND "AKTBO" = 'X'... |
| 1,484,496 | CE4____ | FETCH | 0 | 1403 | |
| 4 | CE4____ | REOPEN | | 0 | SELECT WHERE "MANDT" = '999' AND "AKTBO" = 'X' ... |
| 597,860 | CE4____ | FETCH | 0 | 1403 | |
| 4 | CE4____ | REOPEN | | 0 | SELECT WHERE "MANDT" = '999' AND "AKTBO" = 'X' ... |
| 1,943,660 | CE4____ | FETCH | 1 | 0 | |
| 6 | CE4____ | REOPEN | | 0 | SELECT WHERE "MANDT" = '999' AND "AKTBO" = 'X' ... |
| 1,991,189 | CE4____ | FETCH | 0 | 1403 | |
After fixes
| Duration | Obj. name | Op. | Recs. | RC | Statement |
| 6 | CE4____ | REOPEN | | 0 | SELECT WHERE "MANDT" = '999' AND "AKTBO" = 'X' ... |
| 9,478 | CE4____ | FETCH | 1 | 0 | |
| 6 | CE4____ | REOPEN | | 0 | SELECT WHERE "MANDT" = '999' AND "AKTBO" = 'X'... |
| 8,224 | CE4____ | FETCH | 1 | 0 | |
| 4 | CE4____ | REOPEN | | 0 | SELECT WHERE "MANDT" = '999' AND "AKTBO" = 'X' ... |
| 8,048 | CE4____ | FETCH | 1 | 0 | |
| 5 | CE4____ | REOPEN | | 0 | SELECT WHERE "MANDT" = '999' AND "AKTBO" = 'X' ... |
| 12,448 | CE4____ | FETCH | 1 | 0 | |
| 7 | CE4____ | REOPEN | | 0 | SELECT WHERE "MANDT" = '999' AND "AKTBO" = 'X' ... |
| 11,083 | CE4____ | FETCH | 1 | 0 | |
