BusinessObjects and SAP Part 2 of 4 - Creating a X...
Technology Blogs by SAP
Learn how to extend and personalize SAP applications. Follow the SAP technology blog for insights into SAP BTP, ABAP, SAP Analytics Cloud, SAP HANA, and more.
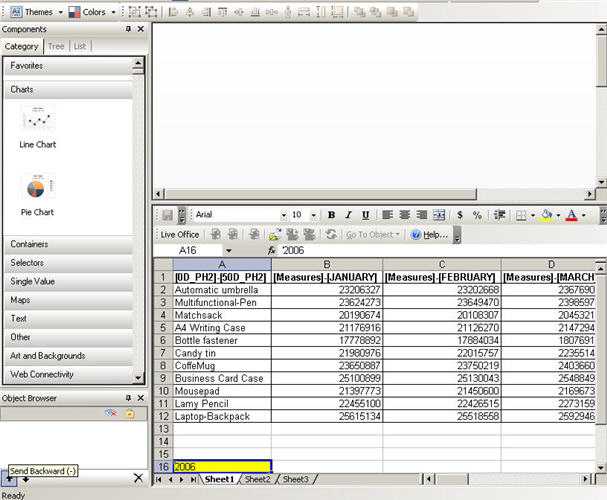
In the first part of this short blog series we created a BI Query, created a Crystal Reports object on top of the BI Query and as last step we created a Live Office document leveraging the Crystal Report object inside Microsoft Excel so that we can no go to Xcelsius and build the dashboard. As a next step we will use the Live Office document as a source for the Xcelsius dashboard. In the Xcelsius Designer open the menu*Data > Import from Enterprise.* You will be asked to authenticate towards the BusinessObjects Edge server. After you authenticated towards the system you will be presented with the folder structure of your system. Navigate to the folder where you stored the Live Office document and select the document. As the next step select the menu *Data > Connections* and click "Add"After doing so navigate to the *Usage* tab. Here you can configure how often the data is being refreshed (using Live Office with the Crystal Reports towards SAP BI as the data source). Check the *Refresh on Load* property Now you can drag and drop a Stacked Bar Chart (or any other chart type fitting your data) to the Xcelsius canvas. Via a double-click you can open the properties of the chart and you will find a icon next to the "Data Values" which allows you to select the range in the Excel spreadsheet. Important to mention here that the spreadsheet is only used during the design time of the Xcelsius visualization and that - in case you not sure how many records will be returned - you can mark a larger range and configure the components to ignore blank rows. Remember that our underlying BI Query contains a SAP variable and that during the creation of the Live Office document we did point the parameter to the cell A16 (see above in Yellow) *(see Part 1 (BusinessObjects and SAP Part 1 of 4 - Creating a Xcelsius Dashboard on top of SAP BI))* Now click the Preview Icon in the Xcelsius designer. Because you are not authenticated against BusinessObjects Enterprise at this time a logon mask will come up and ask for BusinessObjects Enterprise credentials. Use the SAP Authentication and the SAP credentials you can leverage Single-Sign-On from the Xcelsius Dashboard to Live Office and Crystal Reports down to the SAP BI System. Enter you SAP Credentials in the same way we used to enter it in Live Office : 0.1. Example :CIM~003/demo After the authentication the chart will show up with the data retrieved from the SAP BI system via Crystal Reports and Live Office. Go back to the Xcelsius Designer and select the menu *File > Save As >... *and select Enterprise to save the Design of the Xcelsius Dashboard to BusinessObjects Enterprise.