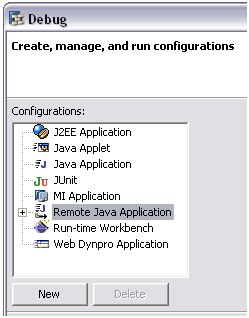
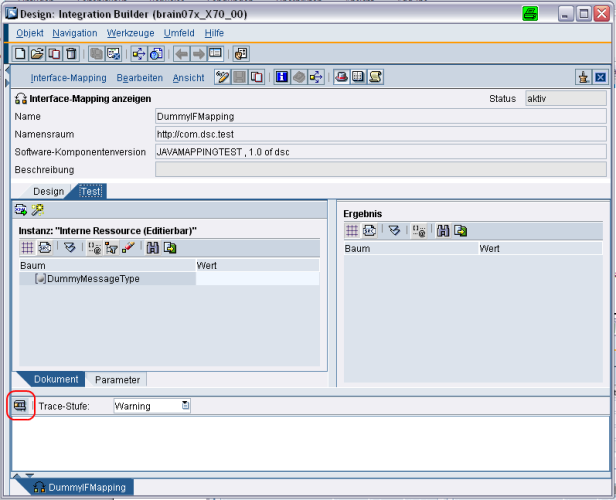
h2. Introduction While there are quite some weblogs regarding the development of Java mappings available on SDN, there is only one regarding the debugging of them (Testing and Debugging Java Mapping in Developer Studio (Testing and Debugging Java Mapping in Developer Studio)). The debugging approach suggested in this weblog is to add a main method to the Java mapping. In contrast to this some forum entries suggest the usages of log messages for debugging. Both techniques are quite "low-level" compared to the functionality offered by debuggers in current Java IDEs like Eclipse. Therefore, this weblog shows how Java mappings can be debugged using the sophisticated debugging functionality offered by the SAP Netweaver Developer Studio. Note that the following step-by-step guide is tailored towards SAP Netweaver 7.0 and SAP Netweaver Developer Studio 7.0. Nevertheless, the presented approach should also be applicable for other versions of SAP Netweaver. h2. Configuration Steps *1. **Configuring the J2EE engine for remote debugging´* The first step is to configure the J2EE engine for remote debugging. The necessary steps are, for example, described here: http://help.sap.com/saphelp_nw70/helpdata/en/ae/40e1407e858031e10000000a1550b0/frameset.htm (http://help.sap.com/saphelp_nw70/helpdata/en/ae/40e1407e858031e10000000a1550b0/frameset.htm) *2. **Configuring SAP Netweaver Developer Studio* The second step consists of two parts. First the J2EE engine needs to be configured in the Developer Studio as described here: http://help.sap.com/saphelp_nw70/helpdata/en/ae/40e1407e858031e10000000a1550b0/frameset.htm (http://help.sap.com/saphelp_nw70/helpdata/en/ae/40e1407e858031e10000000a1550b0/frameset.htm) ** In the next dialog window click on "SAP J2EE Engine" and enter the server host and port of your J2EE engine. The next step is to find out which debug port is used by the J2EE engine. 0.1. Close the dialog window and open the menu WindowàShow ViewàOther... 0.2. Select the J2EE Engine view an click OK 0.1. In the J2EE Engine View select "server0" and note down the Debug Port (51024 in the example). You will need this port later to create a remote debugging configuration. *3. **Implement the Java Mapping and deploy it using the Integration Builder* The next step is to develop and deploy the Java mapping. I won't detail the necessary steps here as they have been covered in several weblogs and forum entries already. However, it is important that the Java mapping is developed using the Developer Studio inside a Java project. For the example described in this weblog I used the following Java mapping. The mapping simply create an output XML consisting of just one element named DummyMessageType. *package* com.dsc.test; *import* java.io.IOException; *import* java.io.InputStream; *import* java.io.OutputStream; *import* java.io.OutputStreamWriter; *import* java.nio.charset.Charset; *import* java.util.Map; *import* com.sap.aii.mapping.api.AbstractTrace; *import* com.sap.aii.mapping.api.StreamTransformation; *import* com.sap.aii.mapping.api.StreamTransformationConstants; *import* com.sap.aii.mapping.api.StreamTransformationException; *public* *class* JavaMappingTest *implements* StreamTransformation { Map params; *public* *void* setParameter(Map params) { *this*.params = params; } *public* *void* execute(InputStream in, OutputStream out) *throws* StreamTransformationException { AbstractTrace trace = (AbstractTrace) params.get(StreamTransformationConstants.MAPPING_TRACE); trace.addInfo("JavaMappingTest start"); OutputStreamWriter osw = *new* OutputStreamWriter(out, Charset.forName("UTF-8")); *try* { } *catch* (IOException e) { *throw* *new* StreamTransformationException( "Error executing java mapping.", e); } trace.addInfo("JavaMappingTest ended"); } } *4. **Creating a remote debugging configuration in the Developer Studio* After the Java mapping has been deployed using the Integration Builder a remote debugging configuration needs to be created in the Developer Studio. To create this configuration perform the following steps: 0.1. Open the menu RunàDebug... 0.2. In the next dialog window select "Remote Java Application" and click "New" 0.1. Enter a name for the newly created configuration (Java Mapping Debugging in the example), select the Java project you used to develop the Java mapping and select "Standard (Socket Attach)" as the connection type. In addition you must enter the host name of your J2EE engine (the same you entered in Step 2 and its debug port. Save the changes and close the dialog window. h2. Debugging Now everything is ready to start the remote debugging of the Java mapping. *1. **Setting a break point* Open the Java mapping in the Developer Studio and double-click in the on the sie bar of the editor to create a break point. *2. **Start the remote debugging configuration* Click on the debug icon and select the remote debugging configuration you created for the Java mapping. The Developer Studio will switch to the debug view. *3. **Trigger the execution of the Java mapping* Next the execution of the Java mapping needs to be triggered. To do this open the Integration builder and navigate to the interface mapping that contains the Java mapping class. Switch to the "Test" tab, prepare the test message and click on execute to start the trigger the execution of the Java mapping. *4. **Debug* The execution of the Java mapping stops at the break point created earlier. Now it is possible to step through the Java mapping code line by line and debug it using the Developer Studio debugging features.