CPH - Central Performance HistoryDAY 1| DAY 2| ADDENDUM 1 | jim.spath/blog/2008/06/03/an-old-dog-tries-new-tricks--ccms-ii-adm107--addendum-2-cph-02-jun-2008
I started this blog in November 2007, right after getting back to the office after taking the ADM107 class. I intended to put what I learned into practice "soon" so I would not forget what I learned. Well, it's now the middle of February 2008 and we have finally made time on the calendar to get back to this.
This addendum (#1) will describe prerequisites we met, the agent configuration in our sandbox system, show the results of the first few days with one monitoring agent, and talk about the next steps.
Life is relatively easy when you're in a class, with a focused instructor, classmates working on more or less the same objective, a system or set of systems that have been tailored fresh out of the box, and a generally distraction free environment. Go back to the office and guess what? Priorities intrude, the system isn't as clean and stable as in the lab, and most important, changes to even a sandbox system can interfere with developers projects and timelines. The nice thing about using your own systems is that the date and time formats are what you expect, in your timezone.
Anyway, back to Chapter 1. Install the CCMS agents. Make sure they stay running.
Our topology for baby step #1:
Central Performance History (CPH) will reside on our Solution Manager system. As of today, this is a single node. Thus, no high availability, no path to production. When the system goes down for maintenance, backups, etc., it's down.
We will install agents on R/3, BW and SCM systems, starting with R/3.
So, which agents? Basis said we shall have "sapccmsr" and "sapccm4x". So we shall.
Agent Health Check
Fast forward past the agent install, which apparently went online in November:
The agents we have are from September 2007, so they are pretty fresh.
The next step is to log into the SAP system to verify the agents are running.
Transaction RZ21 "Monitoring: Properties and Methods" is the starting place for configuration and verification steps. As in many cases, a few menu paths lead to the same place. Under topology, pick "Agents for Remote Systems".

Or, under "Technical Infrastructure", pick "Display Topology".

In class, we installed, configured, tested and used Windows agents. At work, we have UNIX, so the OS start up routines are different. In either case, the agent tests need to pass. We found one "ONLINE" and one "SHUTDOWN".


Being UNIX savvy, I checked and found only one daemon running:
If you look closely, the running daemon is "sapccmsr" while the reported shutdown agent is the "sapccm4x" one. Don't ask me, I'm an engineer, not a topologist! After the Basis team went back to their desks and threw some runes, these were running:
Then, clicking on the "Monkey Wrench" icon as circled above showed successful connection where it had not before.

Monitoring Configuration
Let's go to transaction RZ23N, "Central Performance History" (hooray) and select "Assign Procedure"

We picked generic table buffer hit ratio as the first element to track (big surprise - see my blog on table buffer tuning).
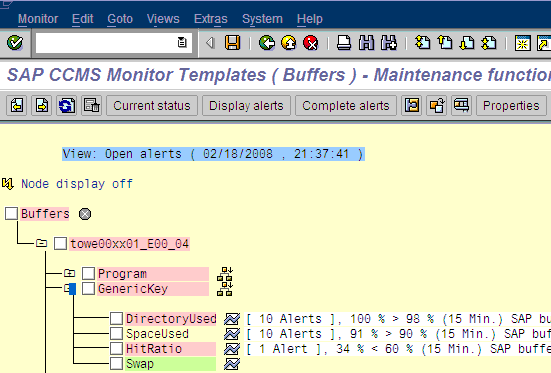
To verify that CPH is recording correct values, we can use a parallel test. Here are 2 shots from the RZ20 monitoring tree drill down:
OK

BAD - the hit ratio has dropped. We shall see if this is noticeable with one-hour collection and daily aggregation. It might be necessary to use 15-minute (quarter hour) intervals.
Pick one from Column A, one or more from Column B and one from Column C. This screen shot is bizarrely collapsed to below 600x400 size.

Here is verification that the background jobs are running:

The above is visible in RZ23N via "Collection/Reorganization Jobs".
Reporting
This menu is accessed via RZ23N "Overview of Available Data" once the gears are turning.

Here is the CPH report grid in 2 dimensions, showing data have been collected over the past several days. It works!

As noted, this is an ALV graphic directly created within CPH menus. I've altered the Y-Axis to include a maximum 100% (it was 101%) and a minimum 95%. I also selected one hour which showed up as red squares on multiple days. That's handy I guess.

I then brought the same data into Excel and created a scatter diagram. This is a little easier on my eyes.

Next Steps
- Add more MTEs. We have a short list and a long list.
- Add other systems. The sandboxes are refreshed, so we should protect this work.
- Include specific dialog transactions to track. This is a primary goal to replace daily manual data collection.
- Increase the data cache to 40MB, per the book.
- Figure out why the book says to update Op Modes, as it seems to work though we skipped that step.
- Feedback analyses from these reports to the Basis and development teams as needed.
- Hook this into our enterprise monitoring system, whether through auto reaction or another process,
[All opinions expressed are mine. No opinions were harmed in writing this blog.]
