The runtime analysis tool allows you to examine the performance of any ABAP programs, such as reports, subroutines, function modules or classes, that you create in the ABAP Workbench. It saves its results in performance data files, which you can display as lists. You can use these results to identify runtime-intensive statements, to combine table accesses, and show the hierarchy of program calls. Normally you use the runtime analysis tool to measure the runtime of complex program segments or complete transactions (if you want to measure the runtime of smaller program segments or individual ABAP statements you can use the ABAP statement GET RUN TIME FIELD ). However, we use only simple examples in this weblog, in order to make the understanding easier.
The Programs to be Analysed
Let's assume I am a very newbie in ABAP and I have written a tiny little program which is doing the following: - reading data from a database table - storing that data in an internal table - display that data on a list (at the start of the program you have to specify certain key values; only matching data should be displayed later on). So here it comes (and it seems to work as designed ...) REPORT y_wlog_atra_1. PARAMETERS: p_carrid TYPE sbook-carrid DEFAULT 'LH', p_connid TYPE sbook-connid DEFAULT '0400'. DATA: wa_sbook TYPE sbook, itab_sbook TYPE STANDARD TABLE OF sbook. SELECT * FROM sbook INTO wa_sbook. CHECK: wa_sbook-carrid = 'LH' AND wa_sbook-connid = '0400'. APPEND wa_sbook TO itab_sbook. ENDSELECT. LOOP AT itab_sbook INTO wa_sbook. WRITE: /, wa_sbook-carrid, wa_sbook-connid, wa_sbook-fldate, wa_sbook-bookid, wa_sbook-customid, wa_sbook-custtype. ENDLOOP. A nice colleague has thrown a glance at my source code. He has given the hint to use a WHERE clause with the SELECT statement instead of the CHECK statement for reasons of better performance. So I have written another program ... REPORT y_wlog_atra_2. ... SELECT * FROM sbook INTO wa_sbook WHERE carrid = 'LH' AND connid = '0400'. APPEND wa_sbook TO itab_sbook. ENDSELECT. ... I am curious about the performance now. Let's compare the 2 variants with the ABAP Runtime Analysis tool ...
ABAP Runtime Analysis: Tool & Procedure
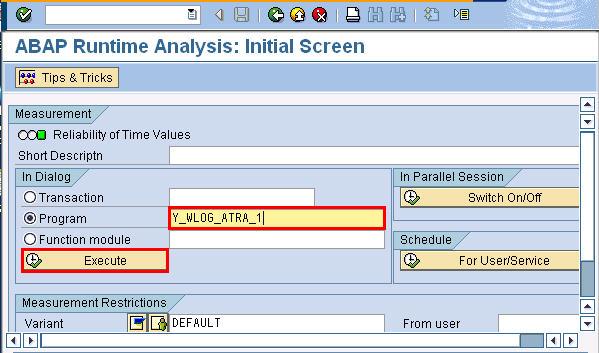
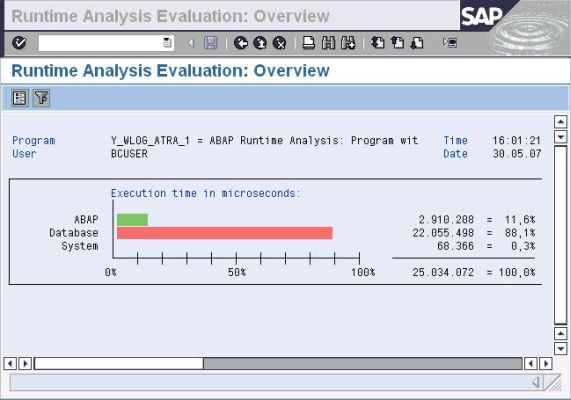
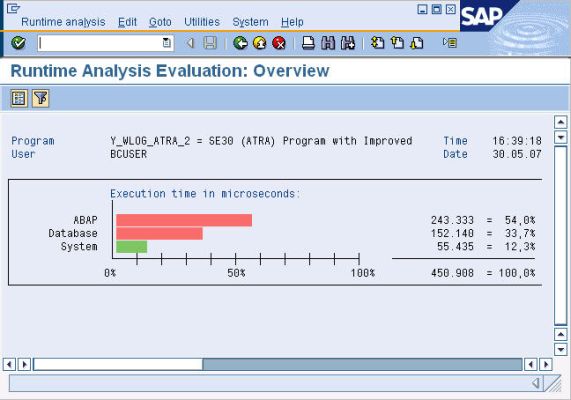
To start it, choose Test --> Runtime Analysis in the SAP Menu, or use transaction SE30 . The runtime analysis procedure consists of two parts: - Recording performance data (upper part of the screen) - Analyzing the performance data (lower part of the screen; this part only appears if there are performance data files in place) The procedure for the first part (Recording performance data): - we go to the initial screen of the runtime analysis (transaction code SE30 ) and specify the name of the first program (Y_WLOG_ATRA_1)in the relevant input field. After that we press the button Execute . The selection-screen of the program Y_WLOG_ATRA_1(including the 2 input fields) is displayed. At the bottom of the screen we are informed that the measurement has been started. We continue by clicking the Execute button. Later on we will see that a file (containing performance data) has been created in parallel. Now we repeat that procedure for our second program (Y_WLOG_ATRA_2). The second step is the analysis of the generated performance data. To do that we have to go to the initial screen of the Runtime Analysis tool again. On the bottom part of the screen you can specify those performance data files you want to analyse. You can see some information related to the last measurement run (in our case that was program (Y_WLOG_ATRA_2). By pressing the button Other File we are able to select those performance data files we like to analyse. I want to see all the files I have created (user BCUSER). I get the relevant list with 2 lines (related to the performance data files of the programs Y_WLOG_ATRA_1 and Y_WLOG_ATRA_2). Based on that list you can display the distinct performance data per line. You have to click in the column Object Type of the relevant line. As a start the tool displays the evaluation overview (showing the cumulated execution times for the ABAP, database and system-level). Here comes the evaluation overview for program Y_WLOG_ATRA_1 We can do the same for the other program Y_WLOG_ATRA_2 By comparing the perfomance data of the 2 programs we clearly see that I have done well with listening to the advice of my colleague. The performance of the second program is dramatically better. In the next step you can forward to a more detailed display of the performance data (Hitlists). That listing shows the different granular execution steps ( according to your filter adjustments ). Here you can easily identify the most time-consuming progam units. And it will also be a good idea to glance at the Tips & Tricks corner. You will find many valuable suggestions about good performance definitely.