What are statistical records?
The ABAP statistical records are very useful if you want to know what’s going on in your system. It’s a technical logging feature implemented in the SAP kernel, and completely independent of the applications. Each dialog step is recorded, an information like user and program name, response time, CPU time and more is logged. This information is very useful when you want to analyze the performance (or a performance bottleneck) of your SAP system. From the statistical records you can get a hint where you should continue with a detailed analysis: CPU or database performance, memory issues, analysis of a particular application, and more.
How are statistical records created?
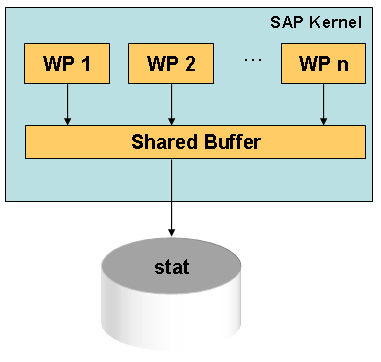
Statistical records are created by the work processes (WP) of an ABAP application server. At the end of a dialog step the WP collects the necessary information like user ID, program name, start time and end time of the dialog step, calculates metrics like response and DB time, and stores all this together in a so-called statistical record. This record is then stored in a shared buffer. All WP of an ABAP application server share the same buffer, and the statistical records are stored in the buffer chronologically.
When the buffer is full it is flushed to a file in the file system. Each SAP application server has it’s own statistics files.
The following screenshot illustrates the architecture.
Where are they stored?
The SAP kernel uses not only one single file for the statistical records. Each hour a new file is created where the statistical records are stored. This keeps the file size small and allows a flexible reorganization of the files (see below).
The files are stored in a directory like /usr/sap/<SysID>/<Instance Directory>/DATA. Try transaction AL11 to display the DIR_DATA directory. You’ll find one file named stat and many files named statnnn (where nnn is a number). These are the statistics files. Don’t try to display these files, they contain binary data only.</p>
How are the stat files reorganized?
The kernel itself maintains the number of statistics files. The profile parameter stat/max_files is used to control the maximum number of statistic files. Each hour a new file is created and the oldest file is deleted automatically. Make sure you have enough disk space available for all the statistic files. Otherwise the syslog (transaction SM21) shows the following message:
> File: /usr/sap/BCE/D26/data/stat
Failed to write to file, error 0028</p>
How can I access statistical records?
Using transaction STAD you can access the statistics files and display the statistical records. Here is a screenshot of the start screen of STAD.

Just specify date, time, and length of the interesting interval and hit the enter key. If necessary you can narrow your search by specifying values for the filter parameters:

If you select the button Server selection you can select the application servers you want to analyze. By default the statistical records of all servers are collected by STAD. Be sure that the checkbox Include statistics from memory is checked. This will force a buffer flush (see above) before reading statistical records from the file system.
Now hit the Enter key. STAD presents the result as a simple list.

Each line represents one dialog step. You can see the starting time of that dialog step, the application server name, and the program or transaction name, respectively.
For each dialog step the several metrics are shown, e. g. response time, CPU time, and DB time (scroll to the right to see these columns).

Please note: you need the authorization profile S_TOOLS_EX to see all user names. Without this profile you will see only your own user name. All other user names will be deleted and STAD only displays “-?-“ instead.
There is one thing I would like to point out here. We have specified an interval starting from 10:04:00, but the list shows a statistical record from 09:59:47. Is this an error? No, because 09:59:47 is the start time of the dialog step. The response time of this dialog step is 621 seconds, so the step ended at 10:10:08. At that time the statistical record was created and written to the shared buffer. And 10:10:08 is definitely inside the interval we have specified for STAD. So, if you are looking for the statistical record of a long running batch job then you need to know when this job ended (e. g. from the job log). In STAD specifiy an appropriate interval around this point of time. STAD will display the records sorted by their start time.
If you double-click one line you will see the details of this statistical record. All metrics are shown. You will have to scroll down a few pages to see all of them. The following example just shows a small part of it.

The section is titled Analysis of time in work process. The executed program was SAPWL_ST03N. The dialog step was started at 15:24:24 and ended at 15:24:30. The response time was 6087 ms, while CPU time was 210 ms.
This information helps if you want to analyze the performance of a single dialog step. You can see why the response time is larger than 6 seconds. CPU consumption is not an issue here in this example, but DB time is very high. So this could be the point where an optimization could start.</p>
Summary
You can see that STAD shows many technical details. All metrics are measured during the execution of the dialog step, and they describe what really happened. This makes the statistical record a valuable source of information about the performance of an application server. The statistical records are used to calculate aggregations (shown in ST03N), and they are used for SAP services like Going Live and Earlywatch Alert.</p>
