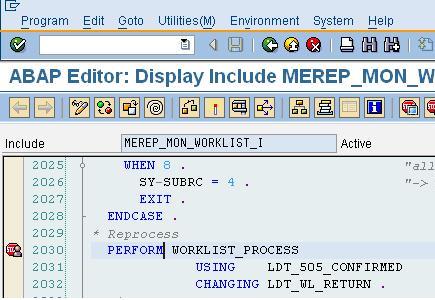
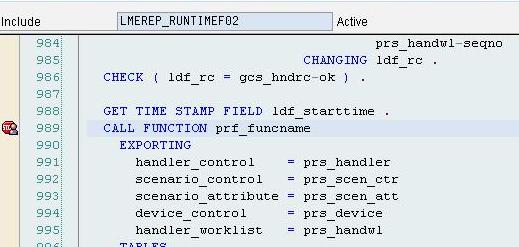
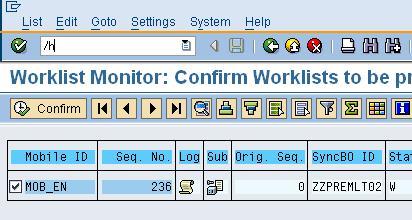
There may have been situations during development when you have always wanted to debug the generated function modules of SyncBOs in order to check if the Custom development in the SyncBO Exits is working in expected way or to trouble shoot any problems in the downloader or uploader function modules (FMs) of the SyncBOs. The Debugging done for synchronous and Asynchronous SyncBOs is different since the processing of the client request is different. Processing of the former is done in the foreground which enables debugging by making use of HTTP debugging feature. The later type of process is done in background task and hence HTTP debugging is not possible. The following explains the steps involved in debugging the Synchronous and Asynchronous SyncBOs Debugging for Synchronous SyncBOs: 1. Activate the External Debugging ( also called as HTTP Debugging ). This can be activated by opening any program in SE38 and navigating from menu Utilites>Setting>Debugging Tab.In the tab check the Actv. checkbox. 2. Goto the Generated FMs of the SyncBO that needs to be debugged through SyncBO builder. 3. Select the downloader function module and set the http break point at 'CALL FUNCTION 'MEREP_RUNTIME_LOADER' in the code displayed. 4. Go to SyncBO Builder repeat the step 2 and select the uploader function module. 5. Set the http break point at 'CALL FUNCTION 'MEREP_RUNTIME_LOADER' in the code displayed. 6. Log into middleware using SAPGUI with same user as the http breakpoint has been set. If this step is not followed the control will not stop at the break point set. 7. Make changes in the MI client application using the same SyncBO and synchronise with the same user. 8. A new window with control stopped at the break point set in the downloader will popup. Debugging for Asynchronous SyncBOs: 1.Disable the SyncBO which you want to debug in Profile Dialog (MEREP_PD). 2.First Break point. 3.Second Breakpoint(change the value of SY-DEBUG to X during debugging) 4.Third Break point (change the value of LDF_SYNC_TYPE to S during debugging) 5.Fourth Break point. 6.Fifth Break point. 7.Sixth Break point (Call for the downloader). 8.Seventh Break point (Call for the uploader). 9. Disable the SyncBO which you want to debug in Profile Dialog (MEREP_PD). 10.Make changes to the SyncBO data on the client and Synchronise with the middleware. 11.Open Worklist Monitor (MEREP_MON) by giving the Mobile Id of the Application installed. Here the SyncBO will be in Inbound worklists in waiting state. 12.Enable the SyncBO in Profile Dialog (MEREP_PD). 13.Select the SyncBO which is in waiting state in worklist monitor and click on the Trigger Handler button in the application toolbar which will take you to confirmation screen. 14. In the confirmation screen, enter '/h' in the command box to start debugging. 15. Hit F8 key so that the control will stop at the break point mentioned in the step 2. Happy Debugging....