XI Landscape As such XI landscape is just another SAP landscape. But when we take closer look, we realize it’s far more complicated and diverse. As per standard, it has DEV, TEST and PRD environment. XI being middleware is a central point of communication for various SAP and non-SAP systems and as a central point of communication; we constantly need to keep an eye on all these systems. Just to make it further complex, XI itself contains various components some of which reside on ABAP stack while rest are on Java. Apart from Integration Engine, it involves Business Process Engine, Adapter Engine, tRFC / qRFC communication layer. Typically even a simple XI message passes through multiple Systems (Sender system, Integration Server, Receiver system) and even within a system it touches various components (Adapter Engine, Integration Engine, BPE…). And for effective monitoring and functioning of your XI landscape, you need to have proper visibility of all these communication components. But just imagine how it would be if you individually need to login to all these systems, execute different transactions for different components. Fairly complicated, isn’t it ? And this is where XI CCMS Alert Monitoring comes into picture. CCMS : Central Monitoring Tool In such a complicated XI landscape, CCMS provide a central point of collecting all alerts from all components of all systems.  Lets take a look at the different components involved in Integration Server.
 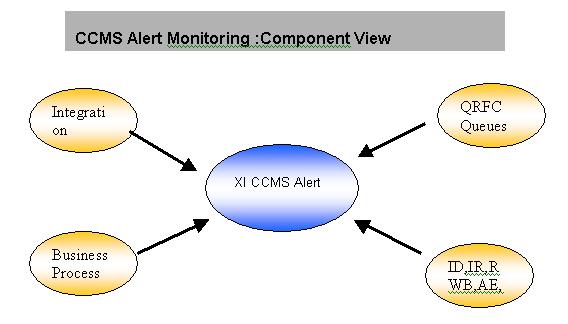 As described in above diagram with XI CCMS Alert Monitoring you can catch alerts from Integration Engine, qRFC queues, Business Process Engine and all Java components. Now if we take a system view of XI monitoring -
  Lets get on to all the sections of Alert Monitoring and their individual features.1. Integration Engine of type Integration Server :This section displays system errors occurred in Integration Engine and the beauty of CCMS is these errors are classified and you view them in different categories. As you can guess receiving errors in categorised format leads to quicker analysis.
  These error categories provide detailed information on •Error Frequency : Error frequency indicates number of error occurred per min for that particular category.•Message alerts by Error Code•Error Code 1………•Error Code nApart from system errors, one of the major feature provided here is Message Performance.
 Here you can determine average processing time for a particular interface specifying Sender service, Receiver service, Interface and its corresponding namespace. We can benchmark processing time for that interface and while message processing when the threshold is overshoot, you’ll red alert in CCMS. I’ll detail this functionality in one of my feature blogs. 2. tRFC / qRFC queues –
On its journey from sender to reciver via Integration Server, a message passes through many queues. But fortunately with CCMS, you can monitor the status of all these queues from a central system.Just to appreciate this, lets list down the queues in each system.Integration Server -EO Inbound (XBTI*)EO Outbound (XBTO*)EO Acknowledgement (XBTB*)EOIO Inbound (XBQI*)EOIO Outbound (XBQO*)EOIO Acknowledgement (XBQB*)Application System-EO Receiver (XBTR*)EO Sender (XBTB*)EO Acknowledgement (XBTB*)EOIO Receiver (XBQR*)EOIO Sender (XBQB*)EOIO Acknowledgement (XBQB*)  3. Heartbeat Data for Java Components: Generic Request and Message Generator (GRMG) Infrastructure is part of CCMS and it provides the heartbeat data for Java components. The heartbeat data mainly focuses on availability monitoring. From technical perspective, there’s a GRMG application (which is JSP / BSP) with well-defined interface, which is called by GRMG infrastructure. It responds to this call with GRMG response which itself is in well-defined XML format. In XI, we can monitor the availability of below Java Components. •Integration Repository•Integration Directory•Runtime Workbench•Adapter Engine•System Landscape Directory
  4. Business Process Engine (BPE): Under this node it reports problem both in BPE deployment and BPE Runtime. BPE deployment lists the problem with deployment and process activation. And runtime problem appear under BPE Runtime. As a standard feature, all these errors are categorised and error frequency data is provided for each category.
  Third Party Monitoring Tools :I’m sure this question would have already popped up in your mind and so did it in mine, when I setup CCMS. I was keen to know if CCMS can be integrated with third party monitoring tools and how do we configure them. To my query, SAP consultant conceded that SAP ‘indeed’ doesn’t provide any documentation about this configuration. After browsing through servicemarketplace however I found some documentation on interfacing SNMP traps with CCMS. For details take a look at http://service.sap.com/monitoring -> CCMS Agents : Features, Installation, and Operation -> Section 5.2 This feature enables SNMP (Simple Network Management Protocol) enabled monitoring tools to integrate with CCMS. Few vendors like BMC offer their own agents for the communication and using these agents we can integrate Patrol with CCMS. HP Open View as well offers some Plug-ins for SAP Netweaver platform. You may find the details at www.managementsoftware.hp.com/
 products/spi/spi_sap/ds/spi_sap_ds.pdf>
