In this weblog, I would like to talk about the HTTP trace for the SAP Enterprise Portal applications. As you know, there are many HTTP trace tools out there. Most of them, you can only capture the data on the client side, and need to take extra efforts to figure it out the network time, and server time. To resolve these problems, SAP Solution Manager Diagnostics provides a tool that breaks down the total response time into network time, server time, client side rendering time etc. With this tool, you can easily figure it out, where the performance bottleneck is.
Introduction to SAP Solution Manager Diagnostics
Before I start, you might ask "what is SAP Solution Manager Diagnostics?".
The Solution Manager Diagnostics (SMD) is a Java-based tool running on SAP Web Application Server 6.40 that provides essential functions and tools to centrally monitor and analyze a complete Netweaver solution landscape. SAP Solution Manager Diagnostics is available since Web AS 6.40 SP10. You will only need to have one such server installed in your entire landscape, and it can monitor/troubleshooting on multiple monitored systems.
The following screenshot gives you a high level overview of SAP Solution manager Diagnostics. You can find the detail information about this tool from SAP Service Marketplace.
 Problem scenario: Why my initial logging into the portal took so long?
Normally, when you encounter such performance problem, you would want to do some HTTP traces to find out what HTTP requests take long time. By using most of the HTTP tracing tools, you could get the total response time for each HTTP request involved in the logon process. But with SAP Solution Manager Diagnostics, you can get the server time, the network time, and the browser time. What is the theory behind it? Let’s have a look how this works.
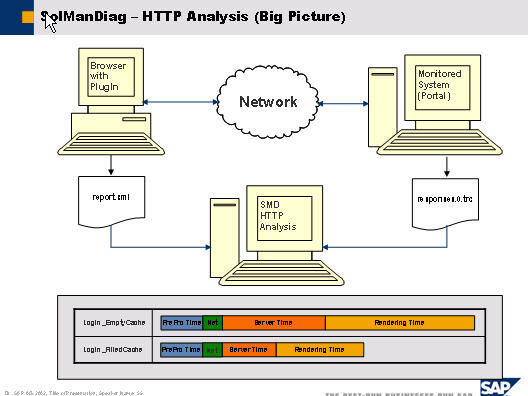
- Using a browser plugin (e.g. IEMon) you can measure the CPU time of the browser -> Rendering time
- With the HTTP Proxy you measure the response time for an HTTP request, i.e. the duration between sending an HTTP request to the server until the last byte of the HTTP response has arrived
- The server time for each HTTP request is logged by the J2EE Engine
- The network time can be calculated from the response time and the server time à Network Time = Response Time -> Server Time

Starting HTTP analysis with SAP Solution Manager Diagnostics
Let’s find out how we can use HTTP analysis from the SAP Solution Manager Diagnostics to identify where the performance bottleneck is for the initial logon:
First, we need to run the browser plug-in to start the trace, this plug-in can be downloaded from the Solution Manager Diagnostics server. The plug-in will launch a browser session for you, and you would type the portal server, and then we can start the trace. After the logon finished, you can stop the trace, and upload the file called report.xml to the Solution Manager Diagnostics server for further analysis. I have provided all steps in the following screenshots.
 Step 0: Click on Download to get the HttpProxy.zip – unpack the zip File to a separate folder if you do not have the plug-in installed yet
  Step 1 – 6:1. Double click on ie-gui.cmd for Analysis of HTTP connections / or ie-https.cmd for HTTPS connections2. Enter Browser URL of analyzing target3. In case of portal enter your credentials4. Name the transaction5. Start the HTTP proxy / Browser PlugIn6. Send the request to the server
 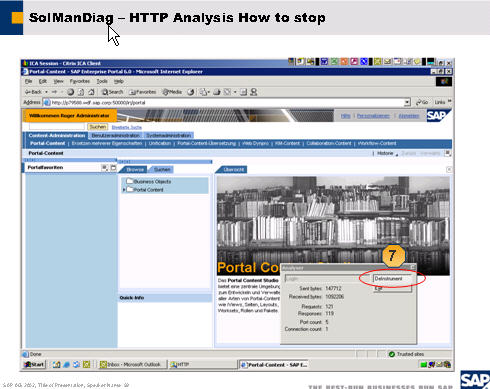 Step 7. End logging of connection details
 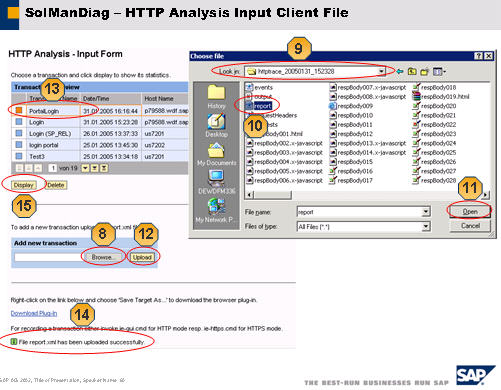 Step 8 - 158. Click ‚Browse...‘ to search for the generated trace file9. Open the folder of your choose in file system10. Mark the report.xml file11. Send the path to upload the file12. Upload the file to the SMD tool13. Make sure that the uploaded file appears at the top of the table14. Check that the upload was successful (There is a warning in case that the tool can not find a corresponding file on server side!)15. Start analyzing by displaying the trace you just uploaded.
 HTTP analysis results
Once we have uploaded the report.xml file, and we can start the HTTP analysis by displaying the trace. The following screenshots showed the results of the HTTP analysis.

From this overview page, we can see that 81% of the response time was network time (28 seconds). We can quickly identify that the performance bottleneck is the network time. In order to improve the initial logon performance, we have to reduce the network time.
Now, let's focus on the network time reduction. To reduce network time, we should consider reducing number of network requests, and the amount of the data needs to be transmitted via the network besides the network itself. Based on the overview page, there are 136 HTTP requests which could generate a few hundreds network level requests, so we have to cut down the number of the HTTP requests.
Let’s do some analysis on the individual HTTP requests for the logon page based on the request table.

By checking into the request table, we found that huge number of HTTP requests were fetching the static content from the Portal server, all these content can be cached at the browser side, or at a local proxy server so all the users can get the content out of a local proxy server rather than from the portal server directly to reduce the WAN traffic.
By caching these cacheable objects, we should see the number of the HTTP requests reduced significantly.
Now, let's take a look another trace for the same initial logon after the content was cached on the browser.

From this trace, we can see that the number of HTTP requests was down significantly, and network time was reduced to around 8 seconds from 28 seconds. Therefore, the overall initial logon performance has been improved dramatically.
Conclusion
From this very simple example, you can see the advantage of using SAP Solution Manager Diagnostics to do the HTTP trace/analysis. It can quickly point you the right direction for further performance tuning.
If you are interested in using the SAP Solution Manager Diagnostics tool to solve your real problems, please go ahead to install the SAP Solution Manager Diagnostics and try it.
You can find the "Supportability Setup Guide Solution Manager Diagnostics" from SAP Service Marketplace.
