
- SAP Community
- Products and Technology
- Technology
- Technology Blogs by SAP
- Gamification with SAP Analytic Application/ Analyt...
Technology Blogs by SAP
Learn how to extend and personalize SAP applications. Follow the SAP technology blog for insights into SAP BTP, ABAP, SAP Analytics Cloud, SAP HANA, and more.
Turn on suggestions
Auto-suggest helps you quickly narrow down your search results by suggesting possible matches as you type.
Showing results for
former_member79
Explorer
Options
- Subscribe to RSS Feed
- Mark as New
- Mark as Read
- Bookmark
- Subscribe
- Printer Friendly Page
- Report Inappropriate Content
04-24-2022
1:56 PM
I'm sure you have heard of SAC Story, but have you heard of SAC Analytic Application? In this blog post, I will share my experience with using SAC Analytic Application and how it can help you take your dashboarding game to the next level.

SAC Analytic Application is unlike your typical SAC Story dashboard. It houses the ability of a low code application, giving it an edge when it comes to customization of the dashboard. In order to make full use of this feature, basic knowledge of Javascript or any coding experience is needed. Some customizations include CSS Customization, script functions and variables, which are not available for SAC Story.
CSS Customization on Analytic Application can be limited, but it still offers you the ability to customize regardless. I mainly used it for changing the color of a button on click, but you can discover more uses for this. You may wish to learn more about CSS Customization for Analytic Application here.
As previously mentioned, I made use of Analytic Application to create a gamified leaderboard. The key here was to create a dashboard that does not come off too plain, with the gamification element still providing some bits of competitiveness for the team in hitting their joint KPIs. It also serves as a central platform for the team to ensure that they are on track for each of the KPIs and are not missing out on anything or whether they are putting more effort into one thing compared to another.
Something I found to be very useful was the ability to set my own script variables in SAC Analytic Application. Script variables are variables that you can set by yourself to use in the Analytic Application. In this case, I made use of it to set the targets for each KPI. Doing so allows for better flexibility in creating changes to the target and bypasses the need for another SAC Modeler or OData Service to house them. This saves time and effort for you, the designer, streamlining the database design process.
Script Variables can be found under "Scripting":
Note that you can choose the type of variables that you are storing. This is similar to how you declare variables in Java or Javascript. In my case, since my KPI targets are numbers, I can make use of either integers or numbers.
Other than the usage of script variables for static KPI targets, I made use of it to pass information between the widgets. For example, I need the top performer for KPI #1, which needs to be extracted from the chart on the bottom left. To do so, I used a script variable of the type String to hold the top performer's name. This script variable is then referenced in a text field to showcase the name of the top performer.
The function to get the name from the chart is more complex, especially since I was using a blended chart (i.e. Chart with data from 2 or more sources). I will put a link in the appendix for your reference.
Coming from a developer background, I struggled with trying to use the low code functionality when attempting to create functions.
I could not make any functions within the scripts itself and started creating repetitive codes. It was a nightmare until...
I found Script Objects. It houses the functions that you would like to create! Here's a quick look at how it works, from a coder's viewpoint.
It was simple enough to use, and was a breeze to set up the function. You can try it out by first making a function to do simple calculations such as summation to get used to how it works.
Tabs were especially useful in trying to showcase more in one dashboard. For my use case, each tab was built to show the top performers for each KPI.

Dropdowns are available in SAC Story. But what makes it so different here in the SAC Analytic Application is the feature of customization. I made use of it to create a list of members that were present in a table. The table comes with a few filters to ensure that the members listed actually have projects in progress or are completed.
To do so, have your table and dropdown ready. Here's how my table looks like:
If you didn't manage to locate the onInitialization method, it is on the left of your screen as shown below:
The onInitialization method runs the code that is placed it in when the user starts up the application. So, anything that you want to showcase immediately on start up should be placed here.
I made use of an OData service connected to a Model to retrieve the data to be displayed on my charts and tables. This should be largely similar to how you would normally use SAC Story. If you want to learn more about how to use the SAC Modeler, try looking here for detailed instructions.
In summary, SAC Analytic Application has much to offer for your dashboarding needs. It can also be extended further to be a low code application that can do calculations for you. I personally find that there are some things I have yet to discover, and requires time to be explored. In the meantime, using these few widgets and functionalities in SAC Analytic Application has provided me with the ability to create a customized application that suits my project needs.
I am very happy with how it turned out and hope that this blog post has exposed you to the powers of Analytic Application. If you have any questions, feel free to drop them down below. Have fun exploring SAC Analytic Application!
Tip: If you are trying to search more about SAC Analytic Application, you may want to try using the term "SAC Analytics Designer" as well.
Getting data from blended charts
Creating buttons to toggle tabs
SAC Analytic Application Developer Guide (As of 2022 Q1)
Latest information/ updates on SAC Analytic Application
I built an Analytic Application for a KPI dashboard and explored its ability to create a gamified leaderboard. Here's what I learned.

Leaderboard created
What SAC Analytic Application offers:
SAC Analytic Application is unlike your typical SAC Story dashboard. It houses the ability of a low code application, giving it an edge when it comes to customization of the dashboard. In order to make full use of this feature, basic knowledge of Javascript or any coding experience is needed. Some customizations include CSS Customization, script functions and variables, which are not available for SAC Story.
CSS Customization on Analytic Application can be limited, but it still offers you the ability to customize regardless. I mainly used it for changing the color of a button on click, but you can discover more uses for this. You may wish to learn more about CSS Customization for Analytic Application here.
What I used SAC Analytic Application for:
As previously mentioned, I made use of Analytic Application to create a gamified leaderboard. The key here was to create a dashboard that does not come off too plain, with the gamification element still providing some bits of competitiveness for the team in hitting their joint KPIs. It also serves as a central platform for the team to ensure that they are on track for each of the KPIs and are not missing out on anything or whether they are putting more effort into one thing compared to another.
1. Script variables
Something I found to be very useful was the ability to set my own script variables in SAC Analytic Application. Script variables are variables that you can set by yourself to use in the Analytic Application. In this case, I made use of it to set the targets for each KPI. Doing so allows for better flexibility in creating changes to the target and bypasses the need for another SAC Modeler or OData Service to house them. This saves time and effort for you, the designer, streamlining the database design process.
Script Variables can be found under "Scripting":

Note that you can choose the type of variables that you are storing. This is similar to how you declare variables in Java or Javascript. In my case, since my KPI targets are numbers, I can make use of either integers or numbers.

Other than the usage of script variables for static KPI targets, I made use of it to pass information between the widgets. For example, I need the top performer for KPI #1, which needs to be extracted from the chart on the bottom left. To do so, I used a script variable of the type String to hold the top performer's name. This script variable is then referenced in a text field to showcase the name of the top performer.

The function to get the name from the chart is more complex, especially since I was using a blended chart (i.e. Chart with data from 2 or more sources). I will put a link in the appendix for your reference.
2. Script Objects
Coming from a developer background, I struggled with trying to use the low code functionality when attempting to create functions.

I could not make any functions within the scripts itself and started creating repetitive codes. It was a nightmare until...
I found Script Objects. It houses the functions that you would like to create! Here's a quick look at how it works, from a coder's viewpoint.

Understanding the different layers of scripting objects
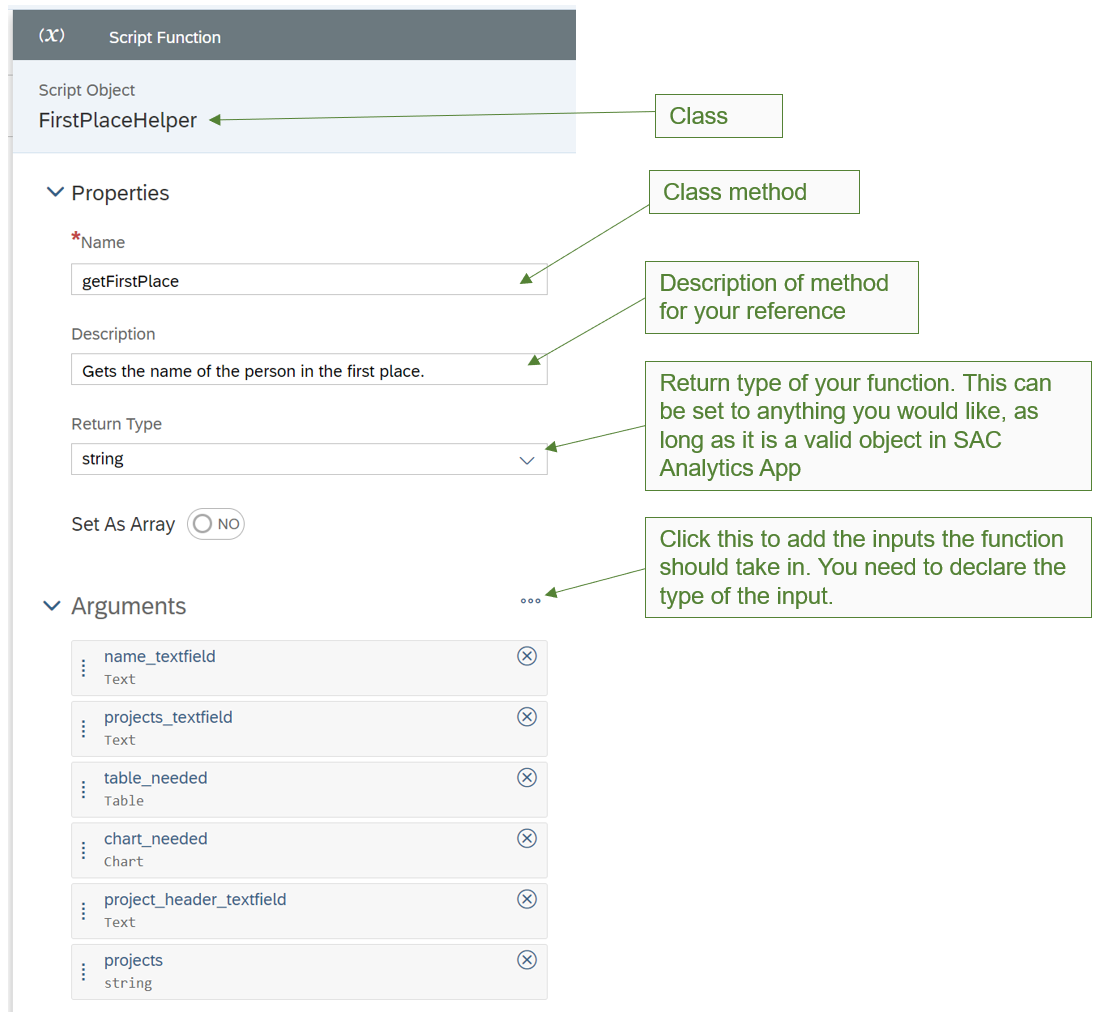
Instructions on how to set up the function inputs. To get to this, simply click the class method (getFirstPlace) from the previous image.
It was simple enough to use, and was a breeze to set up the function. You can try it out by first making a function to do simple calculations such as summation to get used to how it works.
3. Tabs
Tabs were especially useful in trying to showcase more in one dashboard. For my use case, each tab was built to show the top performers for each KPI.
4. Custom Dropdowns
Dropdowns are available in SAC Story. But what makes it so different here in the SAC Analytic Application is the feature of customization. I made use of it to create a list of members that were present in a table. The table comes with a few filters to ensure that the members listed actually have projects in progress or are completed.

To do so, have your table and dropdown ready. Here's how my table looks like:

Use this code to populate the dropdown. You would want it in your canvas' onInitialization method
var DIMKEY_ASSIGNEE = Table_12.getDimensionsOnRows()[0]; // This gets the Assignee key within the table

var SELECTIONS = Table_12.getDataSource().getResultSet(); // This gets all the selections possible in the table (i.e. all data values)

//  It is in a JSON format and can be accessed like a dictionary

for (var i=0;i< SELECTIONS.length; i++) {

	Dropdown_1.addItem(SELECTIONS[i][DIMKEY_ASSIGNEE].id); // For loop to add the names of my members into the dropdown

}
If you didn't manage to locate the onInitialization method, it is on the left of your screen as shown below:

The onInitialization method runs the code that is placed it in when the user starts up the application. So, anything that you want to showcase immediately on start up should be placed here.
Getting your data started
I made use of an OData service connected to a Model to retrieve the data to be displayed on my charts and tables. This should be largely similar to how you would normally use SAC Story. If you want to learn more about how to use the SAC Modeler, try looking here for detailed instructions.
Summary
In summary, SAC Analytic Application has much to offer for your dashboarding needs. It can also be extended further to be a low code application that can do calculations for you. I personally find that there are some things I have yet to discover, and requires time to be explored. In the meantime, using these few widgets and functionalities in SAC Analytic Application has provided me with the ability to create a customized application that suits my project needs.
I am very happy with how it turned out and hope that this blog post has exposed you to the powers of Analytic Application. If you have any questions, feel free to drop them down below. Have fun exploring SAC Analytic Application!
Tip: If you are trying to search more about SAC Analytic Application, you may want to try using the term "SAC Analytics Designer" as well.
Appendix
Getting data from blended charts
Creating buttons to toggle tabs
SAC Analytic Application Developer Guide (As of 2022 Q1)
Latest information/ updates on SAC Analytic Application
- SAP Managed Tags:
- SAP Analytics Cloud, analytics designer
Labels:
1 Comment
You must be a registered user to add a comment. If you've already registered, sign in. Otherwise, register and sign in.
Labels in this area
-
ABAP CDS Views - CDC (Change Data Capture)
2 -
AI
1 -
Analyze Workload Data
1 -
BTP
1 -
Business and IT Integration
2 -
Business application stu
1 -
Business Technology Platform
1 -
Business Trends
1,658 -
Business Trends
93 -
CAP
1 -
cf
1 -
Cloud Foundry
1 -
Confluent
1 -
Customer COE Basics and Fundamentals
1 -
Customer COE Latest and Greatest
3 -
Customer Data Browser app
1 -
Data Analysis Tool
1 -
data migration
1 -
data transfer
1 -
Datasphere
2 -
Event Information
1,400 -
Event Information
66 -
Expert
1 -
Expert Insights
177 -
Expert Insights
299 -
General
1 -
Google cloud
1 -
Google Next'24
1 -
Kafka
1 -
Life at SAP
780 -
Life at SAP
13 -
Migrate your Data App
1 -
MTA
1 -
Network Performance Analysis
1 -
NodeJS
1 -
PDF
1 -
POC
1 -
Product Updates
4,577 -
Product Updates
344 -
Replication Flow
1 -
RisewithSAP
1 -
SAP BTP
1 -
SAP BTP Cloud Foundry
1 -
SAP Cloud ALM
1 -
SAP Cloud Application Programming Model
1 -
SAP Datasphere
2 -
SAP S4HANA Cloud
1 -
SAP S4HANA Migration Cockpit
1 -
Technology Updates
6,873 -
Technology Updates
423 -
Workload Fluctuations
1
Related Content
- Improving Time Management in SAP S/4HANA Cloud: A GenAI Solution in Technology Blogs by SAP
- IoT - Ultimate Data Cyber Security - with Enterprise Blockchain and SAP BTP 🚀 in Technology Blogs by Members
- Unify your process and task mining insights: How SAP UEM by Knoa integrates with SAP Signavio in Technology Blogs by SAP
- Kyma Integration with SAP Cloud Logging. Part 2: Let's ship some traces in Technology Blogs by SAP
- Consolidation Extension for SAP Analytics Cloud – Automated Eliminations and Adjustments (part 1) in Technology Blogs by Members
Top kudoed authors
| User | Count |
|---|---|
| 40 | |
| 25 | |
| 17 | |
| 14 | |
| 8 | |
| 7 | |
| 7 | |
| 7 | |
| 6 | |
| 6 |